Evading Sysmon DNS Monitoring
In a recent update to Sysmon, a new feature was introduced allowing the ability to log DNS events. While this gives an excellent datapoint for defenders (shout out to the SysInternals team for continuing to provide and support these awesome tools for free), for us as attackers, this means that should our implant or payloads attempt to communicate via DNS, BlueTeam have a potential way to pick up on indicators which could lead to detection.
An obvious place where this may affect a campaign is C2 over DNS, where numerous requests will be logged, potentially giving the game away. In the event I came across this deployed during an engagement, I wanted to spend a bit of time understanding just how to work evade detection. In this short post I will document one such way which appears to work with Sysmon 10.1.
But before we start to look to evade Sysmon, we need to first deploy it within a lab environment. To do this, I generally use @SwiftOnSecurity‘s sysmon-config, and install Sysmon with:
sysmon.exe -accepteula -i rules.xml
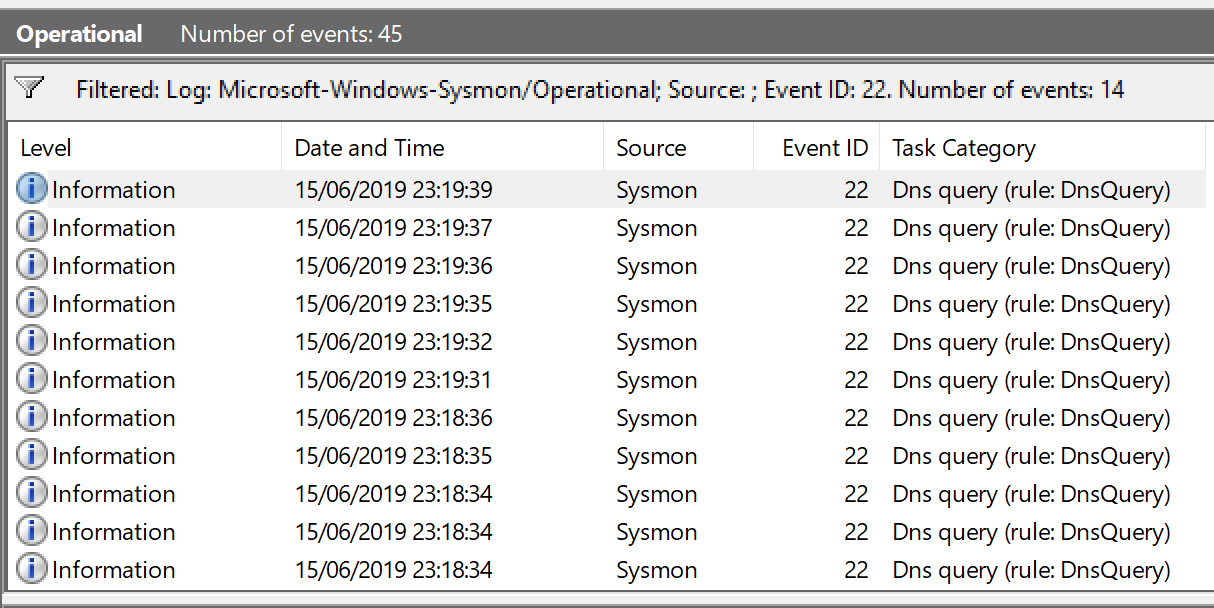
With our test environment up and running, you will start to see events rolling in. Filtering for Event ID 22 will focus on “DNS query”, which will appear like this:

With everything up and running, let’s start by looking how logging is being performed.
How is DNS logging performed?
In order to understand options available when evading detection, I like to start by reviewing just how the solution is working under the hood. In the case of Sysmon, we know from other awesome posts that ETW is heavily used for things like network connection monitoring. So it makes sense that DNS monitoring would be performed in a similar way. If we use the following command, we get our first indication that ETW is the source:
logman -ets

The “Data Collector Set” that stood out to me after installing Sysmon was the strangely named My Event Trace Session. If we dig into this further, we see that this is very likely to be responsible for providing DNS data to Sysmon:

After a bit of searching, the Microsoft-Windows-DNS-Client provider is recommended in numerous locations as an appropriate place to surface information on DNS queries. But before we commit to this being the method, I normally like to cross-reference with the service performing the collection, so into Ghidra we go. Searching for “My Event Trace Session” as a defined string, we find this function:

Here we have a function within SysMon64.exe which references the trace name (as a side-note, this function and name also appears quite similar to the sample code provided within Microsoft’s documentation here). The second parameter to the EnableTraceEx2 call above provides a pointer to the following data:

This is of course the same GUID shown in the logman screenshot above for Microsoft-Windows-DNS-Client of {1C95126E-7EEa-49A9-A3FE-A378B03DDB4D}. So we know for certain that this is how DNS query collection is being performed. Next up, we need to understand just how these events are triggered when a DNS record is requested.
How Windows fires events from DNS
Let’s take a common DNS API call, DnsQuery_A, and attempt to figure out just where ETW data may be surfaced. The obvious place to start is within dnsapi.dll, which hosts the API call. Loading this into Ghidra along with a PDB, we can start to look through functionality which may highlight ETW being used. As we have a GUID we know to be associated with DNS events, we will use this as our datapoint when trying to find a starting point. Somewhat surprisingly, we actually find this GUID within the DLL along referenced by a symbol of DNS_CLIENT:

If we follow references to the symbol DNS_CLIENT, we can see it is assigned within the function McGenEventRegister:
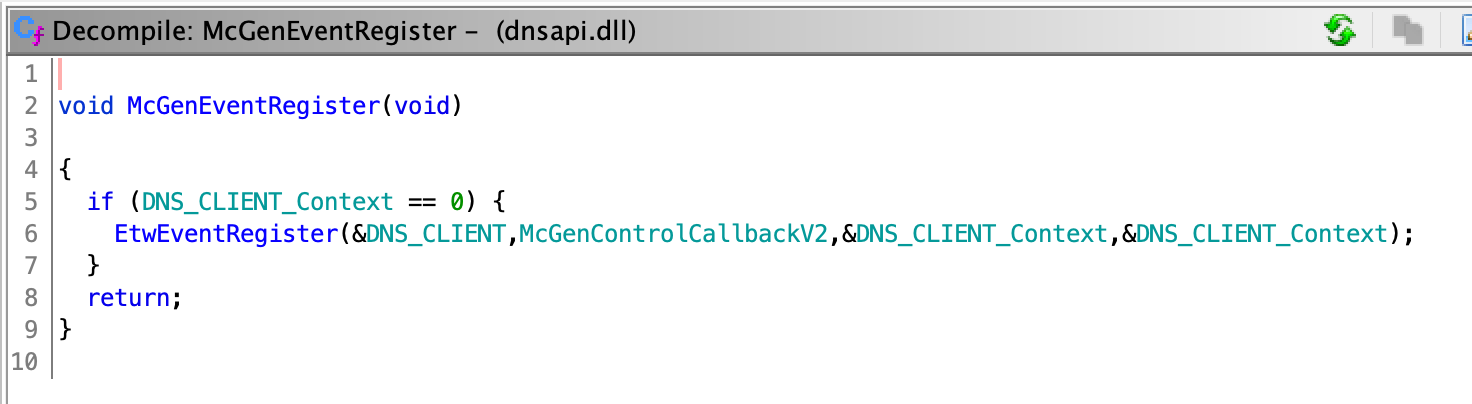
This function is called from DllMain, meaning that a handle (DNS_CLIENT_Context) is created for the purpose of sending events.
To see how this handle is actually used throughout the DLL, let’s create a small application which will perform a DNS query for us:
#include <Windows.h>
#include <WinDNS.h>

int main()
{
	DnsQuery_A("blog.xpnsec.com", DNS_TYPE_A, DNS_QUERY_STANDARD, NULL, NULL, NULL);
}
If we compile this and spin it up in WinDBG, we can add a breakpoint to be triggered on a memory read of DNS_CLIENT_Context using:
ba r4 DNSAPI!DNS_CLIENT_Context
Resuming execution of our application, it doesn’t take long before we hit a breakpoint revealing the following call stack:

Specifically, we find ourselves at the following instruction:
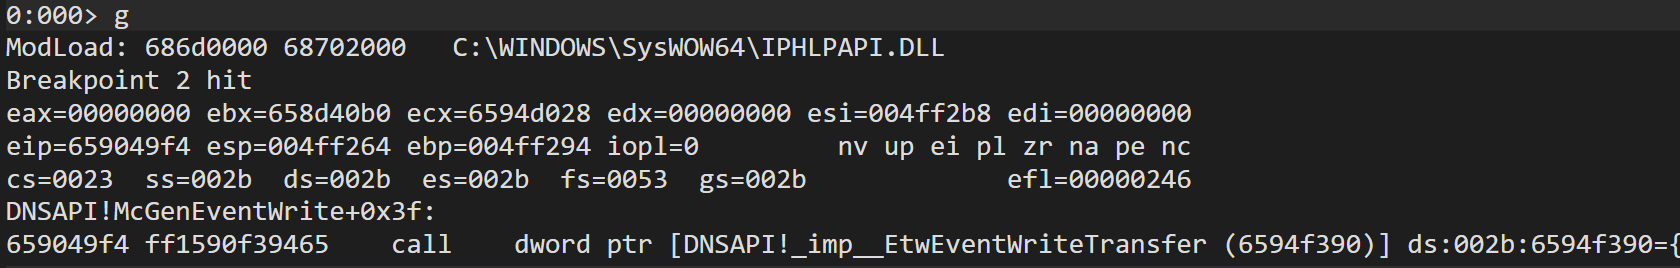
So what does this mean? Well it appears that events are being fired to Microsoft-Windows-DNS-Client from within DnsApi.dll, which is loaded within the attacker process… which we control.
How can we evade detection?
So we know that certain events are being sent from within DnsApi.dll. And we know that we can influence this in the event that the DLL is being invoked from within our process. So this seems like a prime candidate for patching.
How you go about doing this is a matter of personal preference, but for our quick POC let’s attempt to patch DNSAPI!McTemplateU0zqxqz during runtime to return execution without sending an event via EtwEventWriteTransfer. A very simple way to do this would be with something like:
With our patch ready to go, if we attempt to execute our application making a DNS query, we find that we can call the DNS client API without any event being triggered:
Now of course this only shows one possible way to evade this kind of monitoring (with Golang fans likely wondering what all the fuss is about ;), however with an overview of how this works under the hood, you will hopefully be able to tailer your payload to evade detection in the event that you come across this kind of logging in future.
And for any BlueTeam members wondering if you should leverage this technology (or similar)… while nothing is 100% effective, just take a look at the additional steps that we now need to go through to avoid detection.