Windows Anti-Debug techniques - OpenProcess filtering
This week I took a break from SYSTEM chasing to review some anti-debugging techniques. With quite a few Bug Bounty programs available relying on client-side applications, I thought I’d share one of the techniques used by numerous security products (and apparently game anti-cheat engines) to stop you from debugging core components, and just how we can go about bypassing this.
Obviously it goes without saying, but the technique shown in this post is not a vulnerability, if an attacker has this level of access to your system… it was already game over and they are likely just finishing up by installing a rootkit :)
For this post I use AVG as an example, however I have tried to avoid focusing too much on this one product as many other AV solutions and security products use the exact same technique, so the same principals can be applied.
What is the problem
So, if you have ever attempted to launch x64dbg and attach to an AV component before, it’s common that you will see something like this:

Essentially the debugger will fail to attach, and you will be left staring at the screen wondering what to do next. Also, if we just launch the process within the debugger without attaching:

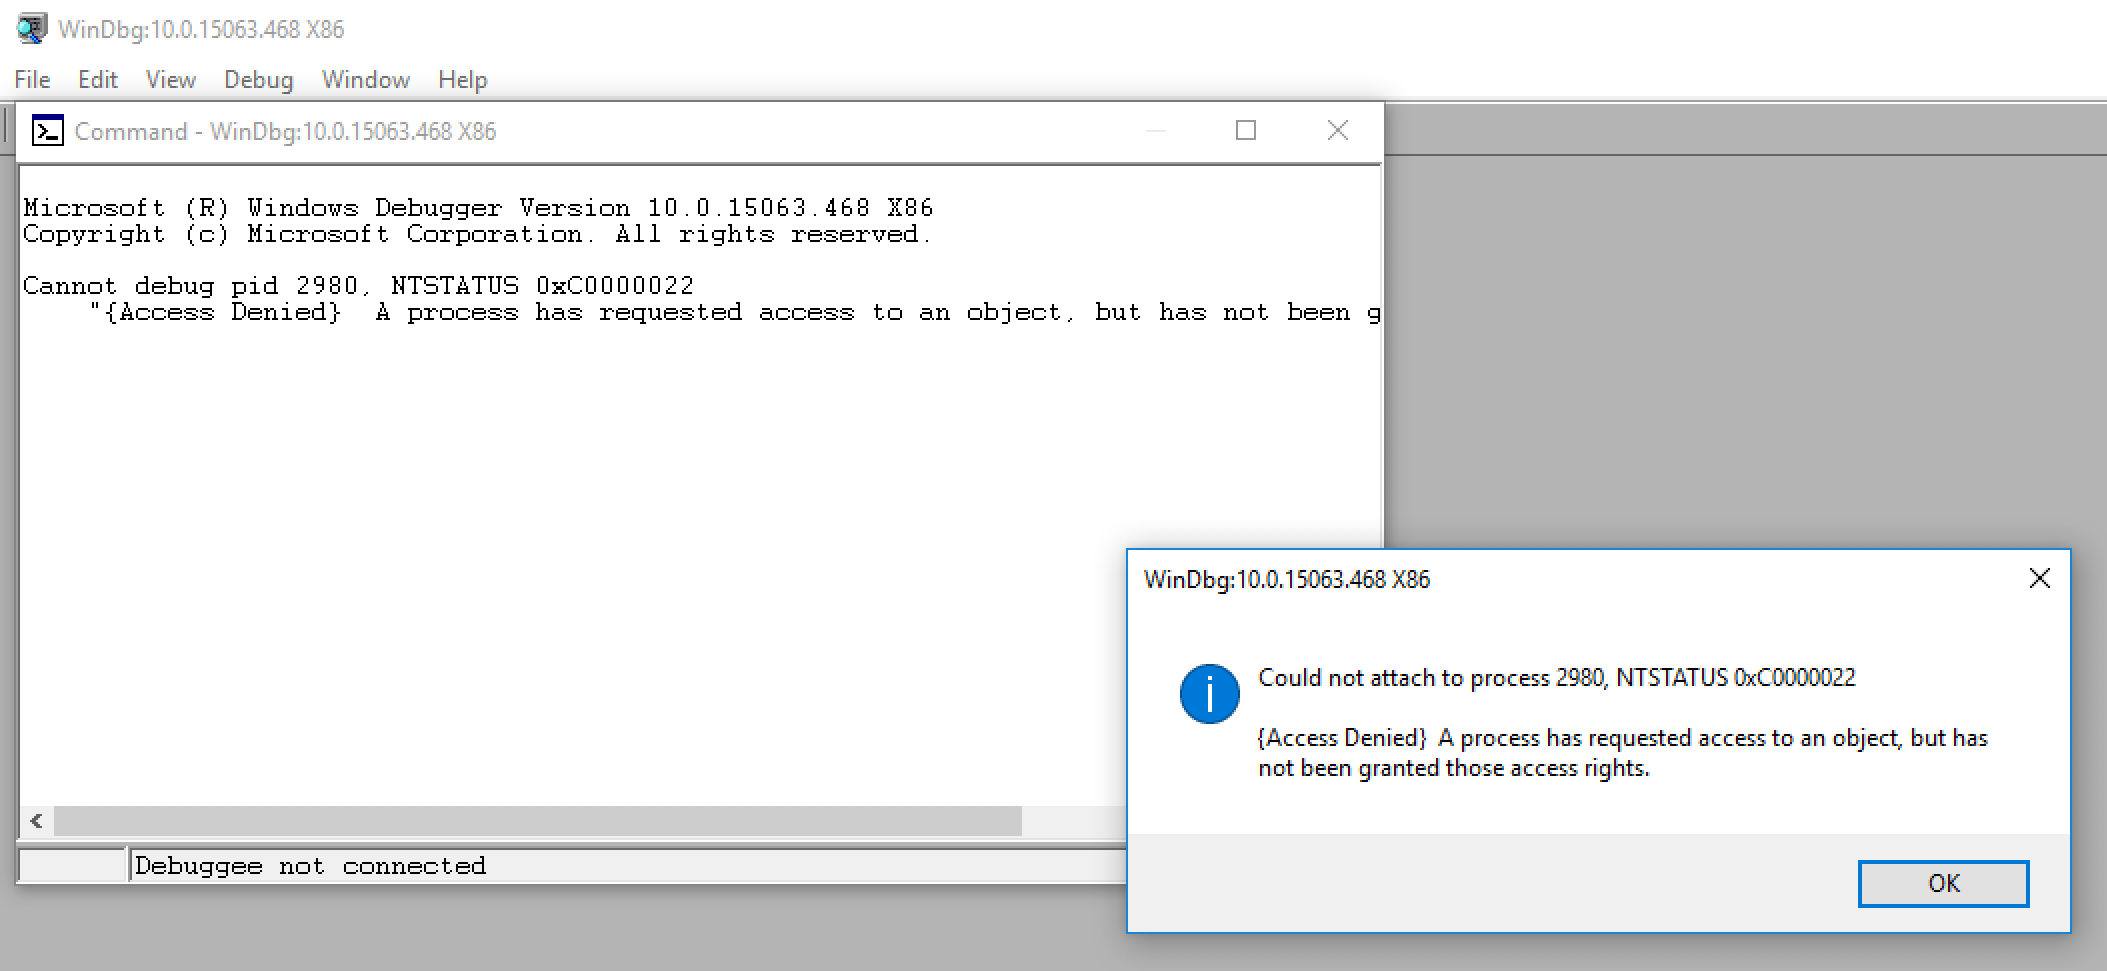
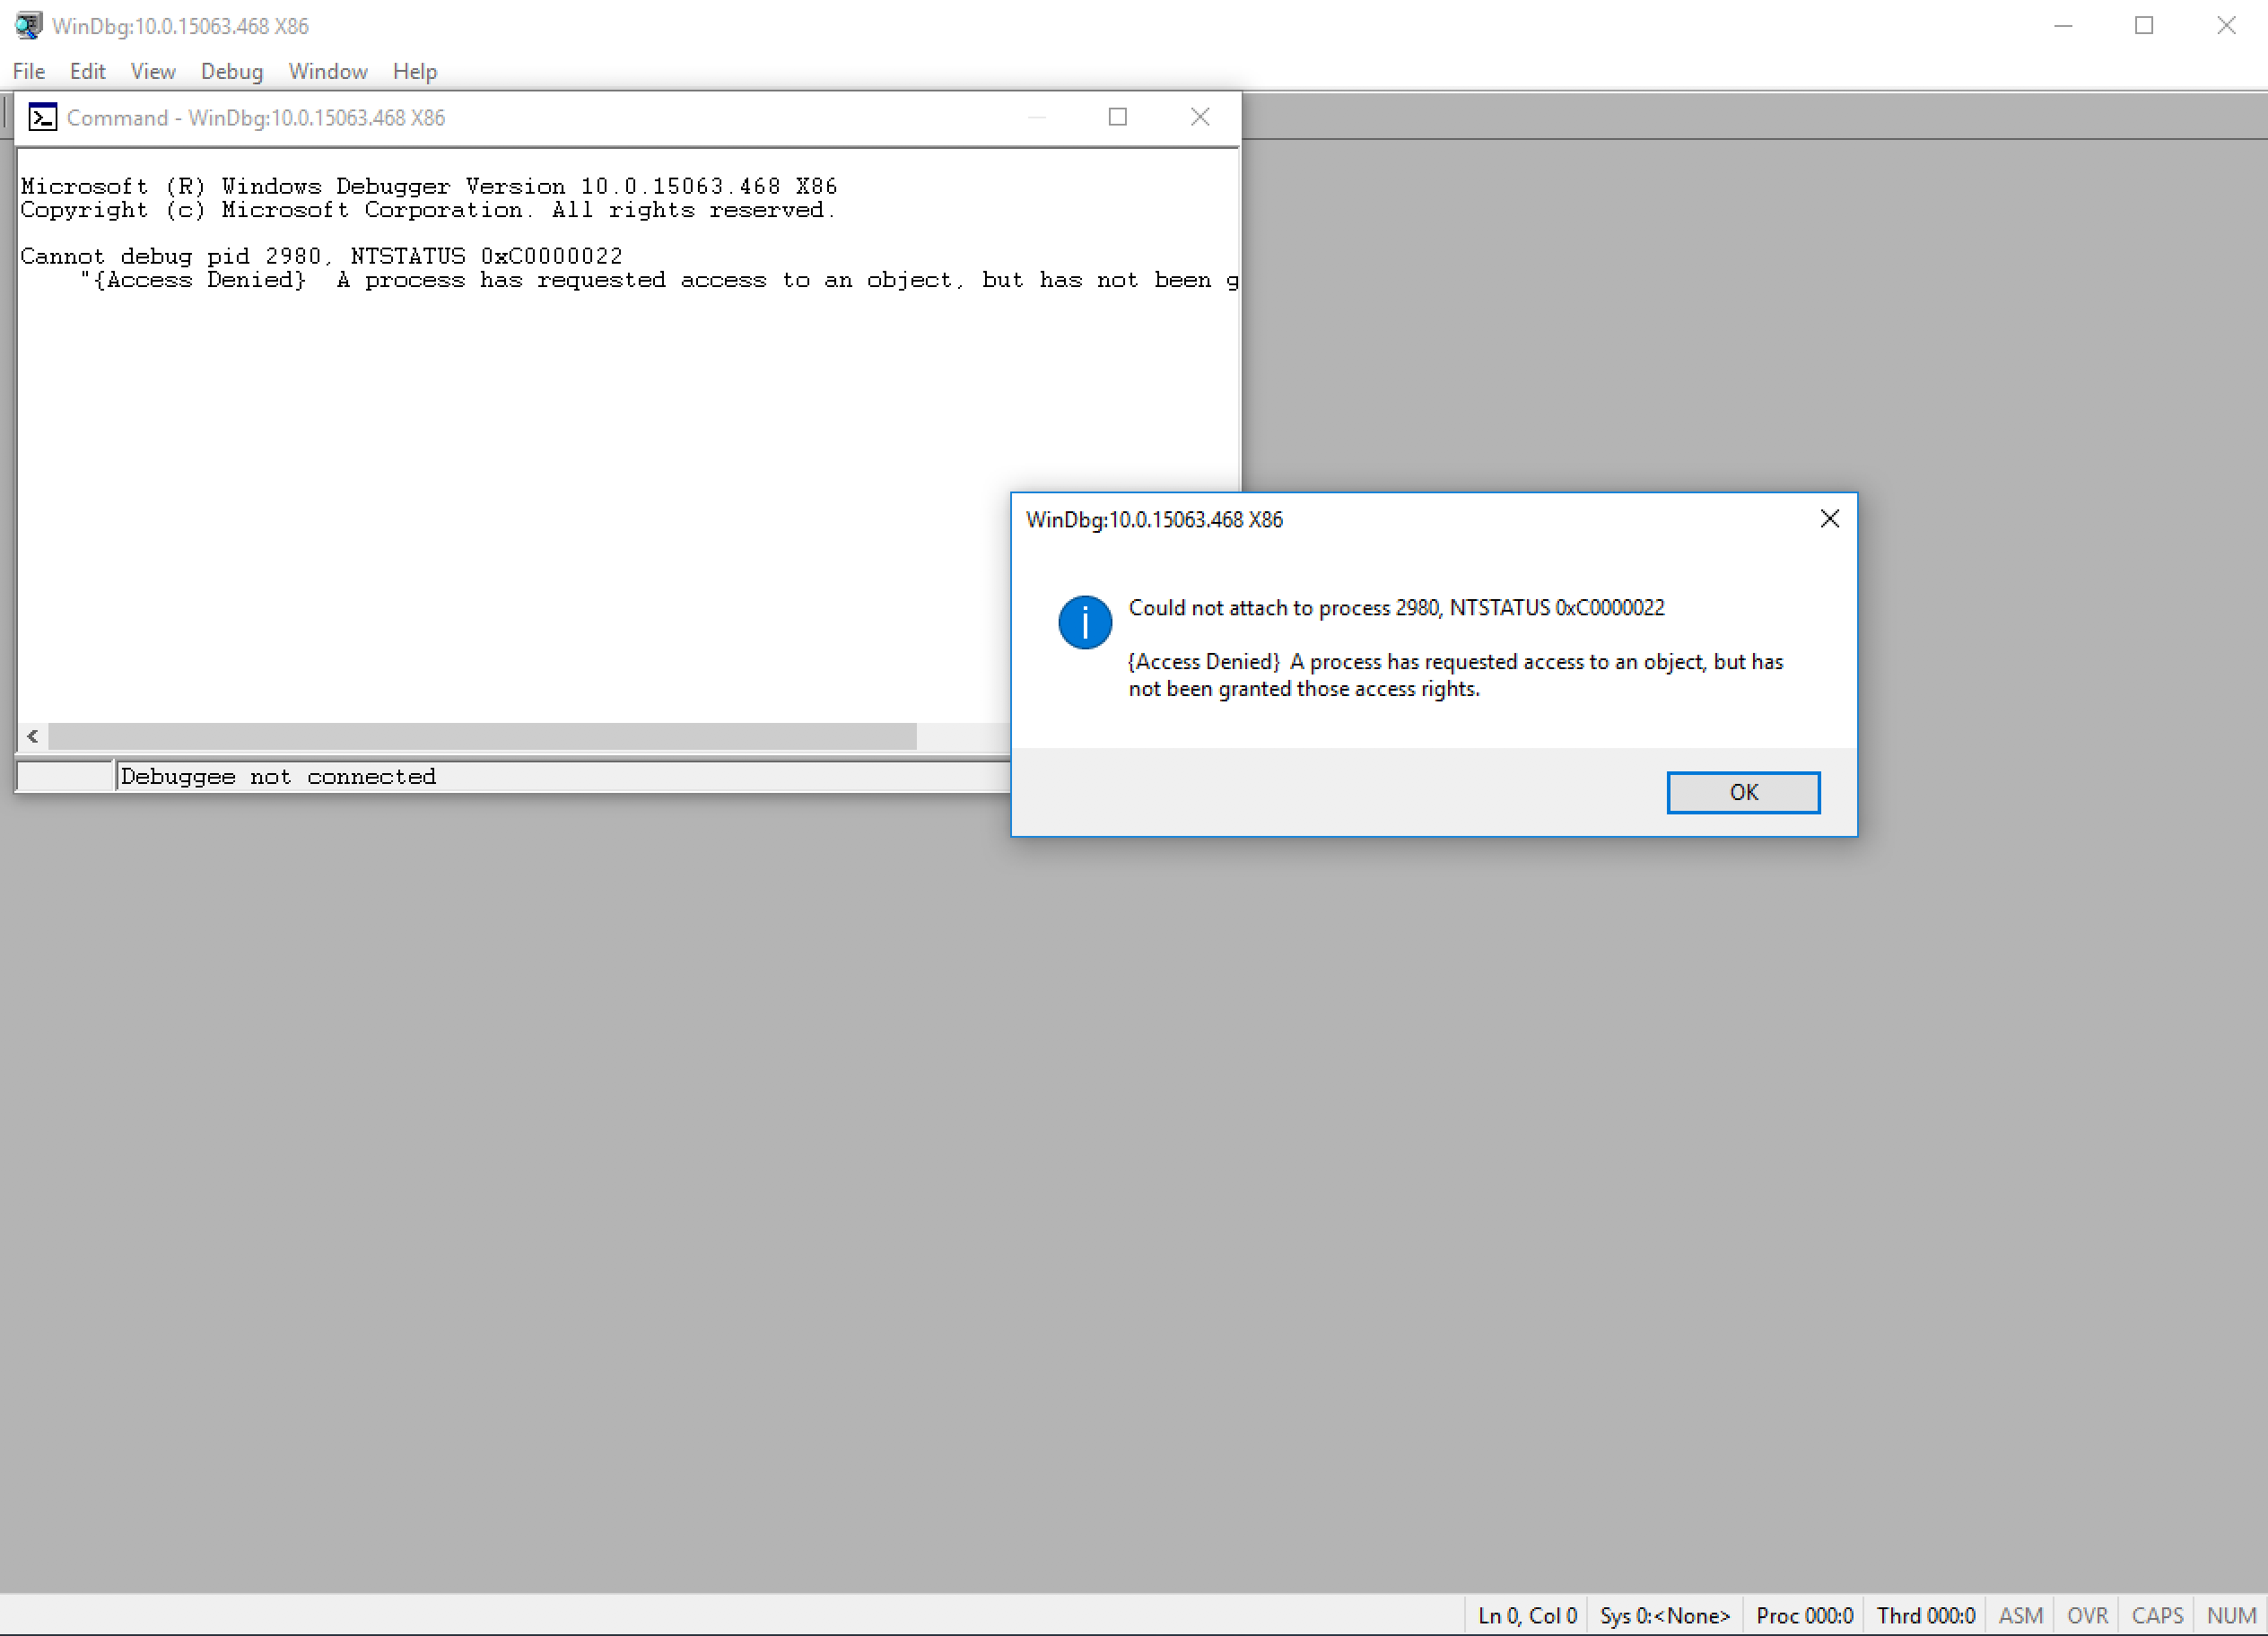
Nope, same result, kicked out when the process is about to start. Finally, like any good RE, we try to fallback to WinDBG and we get an error that looks like this:
To understand just what the debugger is doing, and to give ourselves a better idea of what may be going wrong, let’s take a look at x64dbg code (or actually, TitanEngine, which is the debugging engine that x64dbg uses) to see what happens under the hood when we attempt to attach to a process.
__declspec(dllexport) bool TITCALL AttachDebugger(DWORD ProcessId, bool KillOnExit, LPVOID DebugInfo, LPVOID CallBack)
{
...
if(ProcessId != NULL && dbgProcessInformation.hProcess == NULL)
{
    if(engineEnableDebugPrivilege)
    {
        EngineSetDebugPrivilege(GetCurrentProcess(), true);
        DebugRemoveDebugPrivilege = true;
    }
    if(DebugActiveProcess(ProcessId))
    {
    ...
    }
}
}
Here we see that x64dbg is using the DebugActiveProcess API call, which is a Win32 API provided by KernelBase.dll.
How DebugActiveProcess works
DebugActiveProcess is responsible for kicking off a debugging session with a target process, and takes the PID of the process as an argument. If we review the documentation for the call on MSDN, we come across this:
The debugger must have appropriate access to the target process, and it must be able to open the process for PROCESS_ALL_ACCESS. DebugActiveProcess can fail if the target process is created with a security descriptor that grants the debugger anything less than full access. If the debugging process has the SE_DEBUG_NAME privilege granted and enabled, it can debug any process.
It is here that we are provided our first hint into what may causing our debug session to fail. From the code snippet above, we see that the debugger is calling EngineSetDebugPrivilege, so let’s take a quick look at what this is doing:
DWORD EngineSetDebugPrivilege(HANDLE hProcess, bool bEnablePrivilege)
{
    DWORD dwLastError;
    HANDLE hToken = 0;
    if(!OpenProcessToken(hProcess, TOKEN_ADJUST_PRIVILEGES | TOKEN_QUERY, &hToken))
    {
        ...
    }
        ...
    if(!LookupPrivilegeValue(NULL, SE_DEBUG_NAME, &luid))
    {
        ...
    }
    tokenPrivileges.PrivilegeCount = 1;
    tokenPrivileges.Privileges[0].Luid = luid;
    if(bEnablePrivilege)
        tokenPrivileges.Privileges[0].Attributes = SE_PRIVILEGE_ENABLED;
    else
        tokenPrivileges.Privileges[0].Attributes = 0;
    AdjustTokenPrivileges(hToken, FALSE, &tokenPrivileges, sizeof(TOKEN_PRIVILEGES), NULL, NULL);
    ...
}
Above, the SE_DEBUG_NAME privilege is being assigned to our process token, which means that we satisfy the above requirement for being able to call DebugActiveProcess from our debugger.
The next thing we need to look at is if we have PROCESS_ALL_ACCESS access to the target process.
DebugActiveProcess internals
The DebugActiveProcess API call takes a single parameter of a Process ID, which is used internally to open a handle to the target process via the ProcessIdToHandle call below:
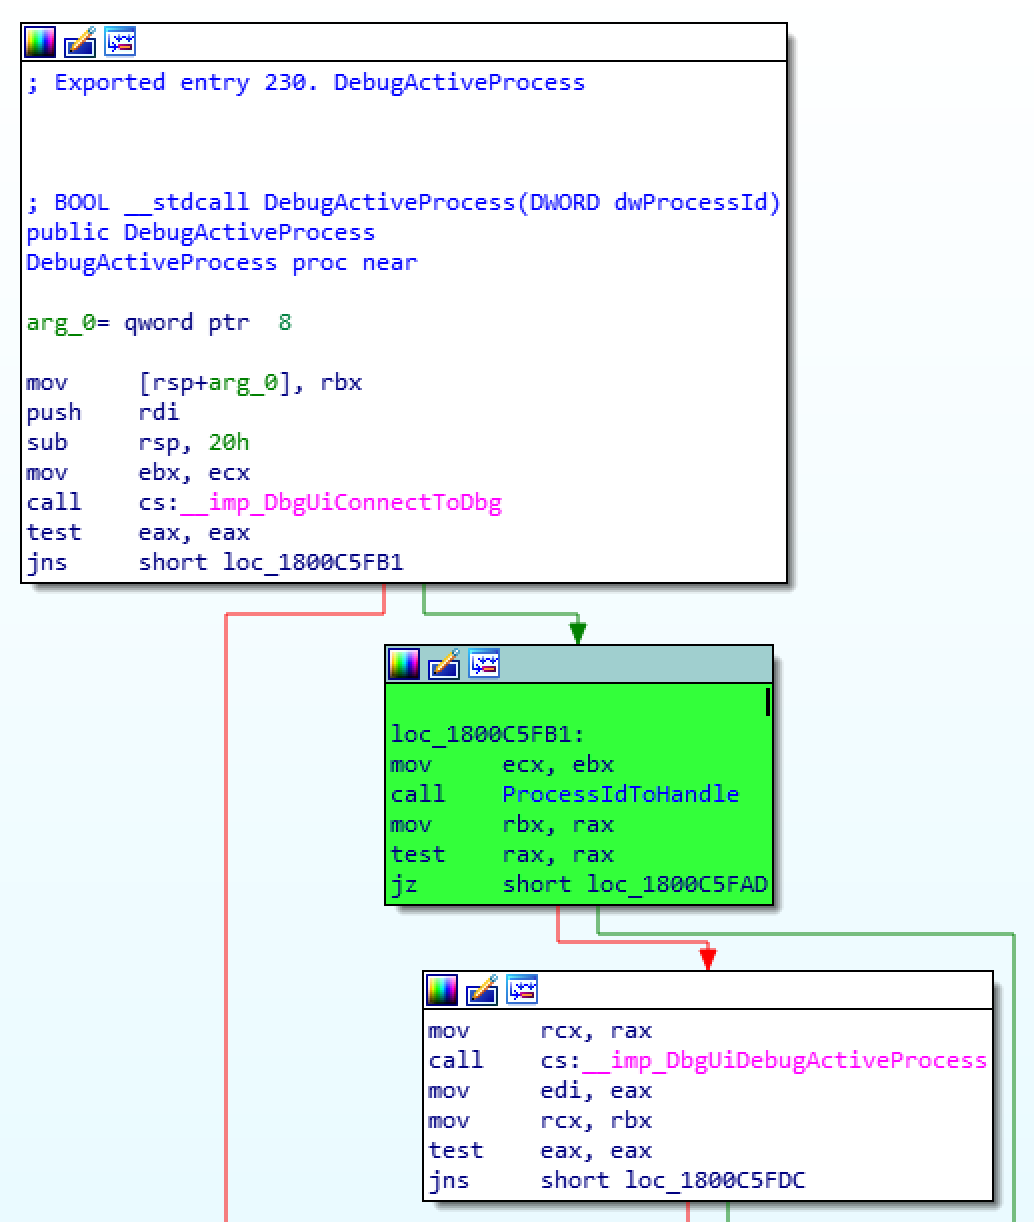
If we jump into the ProcessIdToHandle function, we see that this is simply a wrapper for the NtOpenProcess API call:

The desired access parameter of NtOpenProcess is passed the value C3Ah. We find in the documentation that this is a combination of:
- PROCESS_CREATE_THREAD
- PROCESS_VM_OPERATION
- PROCESS_VM_WRITE
- PROCESS_VM_READ
- PROCESS_SUSPEND_RESUME
- PROCESS_QUERY_INFORMATION
This gives the call all the permissions it needs to begin debugging a process.
So, we know that the debugger has the SE_DEBUG_NAME permission, and the DebugActiveProcess call is giving itself the correct access rights to the target process… so what is stopping us from debugging our target process?
Introducing ObRegisterCallbacks
ObRegisterCallbacks is something that I first came across in the gaming/modding community, where it has been used to thwart attempts to modify or inject functionality into games when bypassing anti-cheat and DRM drivers.
ObRegisterCallbacks, to quote Microsoft, is a “routine which registers a list of callback routines for thread, process, and desktop handle operations.”. This is done in kernel mode, and essentially exposes the ability for driver writers to be notified when a OpenProcess call is made, and when the OpenProcess call returns.
But why would this be useful in preventing debugger access to our AV process? Well one way to prevent the DebugActiveProcess call from succeeding is by filtering out access rights requested during the NtOpenProcess call. By removing the ability for the debugger to request PROCESS_ALL_ACCESS on a target process, we loose the ability to debug a process. This method would also explain the error we saw earlier in WinDBG.
But how do we go about identifying if this is our issue? Let’s jump into a kernel debugger and see how registered callbacks are handled in Ring-0.
(I won’t go into how we set up our kernel debuggger here, but if you need some pointers, check out my previous posts).
ObRegisterCallback internals
With our kernel debugger connection established, we will start with nt!ProcessType:
kd> dt nt!_OBJECT_TYPE poi(nt!PsProcessType)
+0x000 TypeList         : _LIST_ENTRY [ 0xffffcb82`dee6cf20 - 0xffffcb82`dee6cf20 ]
+0x010 Name             : _UNICODE_STRING "Process"
+0x020 DefaultObject    : (null)
+0x028 Index            : 0x7 ''
+0x02c TotalNumberOfObjects : 0x26
+0x030 TotalNumberOfHandles : 0xe8
+0x034 HighWaterNumberOfObjects : 0x26
+0x038 HighWaterNumberOfHandles : 0xea
+0x040 TypeInfo         : _OBJECT_TYPE_INITIALIZER
+0x0b8 TypeLock         : _EX_PUSH_LOCK
+0x0c0 Key              : 0x636f7250
+0x0c8 CallbackList     : _LIST_ENTRY [ 0xffffa002`d31bacd0 - 0xffffa002`d35d2450 ]
This symbol provides a pointer to a _OBJECT_TYPE object, which defines the “Process” type and, of particular interest to us, a CallbackList property. This property defines a list of callbacks which have been registered by ObRegisterCallbacks, and subsequently, each is called by the kernel when an attempt is made to acquire a process handle. Knowing this, we can traverse the list to find any registered handlers which may be interfering with our OpenProcess calls.
The CallbackList is a LIST_ENTRY pointing to a CALLBACK_ENTRY_ITEM structure. This structure is not exposed by Microsoft’s documentation, but thanks to “DOUGGEM’S GAME HACKING AND REVERSING NOTES” site, available here, we are given the structure definition as:
typedef struct _CALLBACK_ENTRY_ITEM {
LIST_ENTRY EntryItemList;
OB_OPERATION Operations;
CALLBACK_ENTRY* CallbackEntry;
POBJECT_TYPE ObjectType;
POB_PRE_OPERATION_CALLBACK PreOperation;
POB_POST_OPERATION_CALLBACK PostOperation;
__int64 unk;
}CALLBACK_ENTRY_ITEM, *PCALLBACK_ENTRY_ITEM;
What we are interested in here is the PreOperation property of the structure.
We can iterate over the list of CALLBACK_ENTRY_ITEM‘s with the following WinDBG command:
!list -x ".if (poi(@$extret+0x28) != 0) { u poi(@$extret+0x28); }" (poi(nt!PsProcessType)+0xc8)
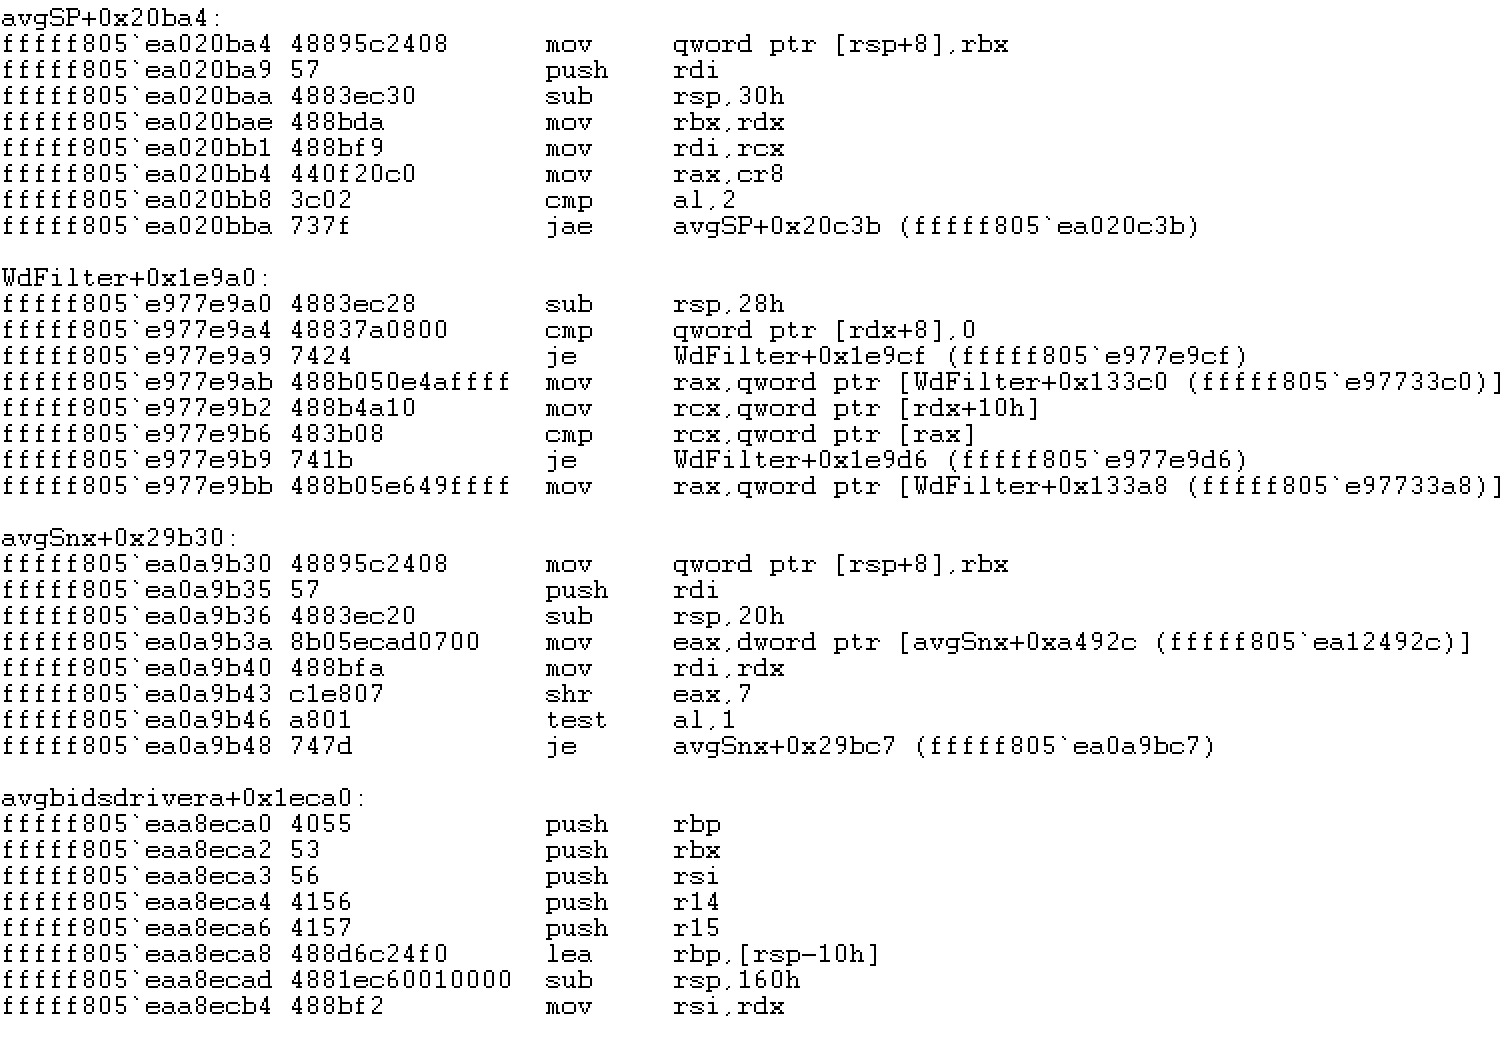
In my case I have 4 drivers which have registered a PreOperation callback function using ObRegisterCallbacks. Let’s grab the driver names using WinDBG so we can see where we need to inspect further:
!list -x ".if (poi(@$extret+0x28) != 0) { lmv a (poi(@$extret+0x28)) }" (poi(nt!PsProcessType)+0xc8)

Of the 4 drivers listed, one is immediately suspected as being the culprit… avgSP.sys:

It makes sense that the “AVG self protection module” would be the driver restricting our abilities to attach a debugger (although it’s much more likely that this is simply collateral damage which occurs when attempting to stop malware from tampering with the AntiVirus engine). Let’s dig into the driver to see if we can see any signs that this driver is responsible for tampering with our OpenProcess call.
First we hunt for ObRegisterCallbacks, which can be found registering a handler below:

If we review the registered handler, we quickly see something like this:

Here, the magic value of A0121410 shown in the disassembly actually corresponds to the permissions:
- PROCESS_VM_READ
- PROCESS_QUERY_INFORMATION
- PROCESS_QUERY_LIMITED_INFORMATION
- READ_CONTROL
- SYNCHRONIZE
So essentially if only these permissions are set, then additional checks are not performed and the OpenProcess call continues unfiltered. However, if any permission other than the above whitelisted permissions are requested, a number of further checks are performed and ultimately the permissions are filtered out before the call returns:

I won’t dig too much into the driver specifics here, as this post is intended to show a generic way to identify and remove this kind of hook for any product rather, but from the above it’s clear that we have found a driver intercepting and modifying our OpenProcess attempts.
Now we have found our culprit, let’s unhook this handler from the kernel.
Unhooking the OpenProcess filter
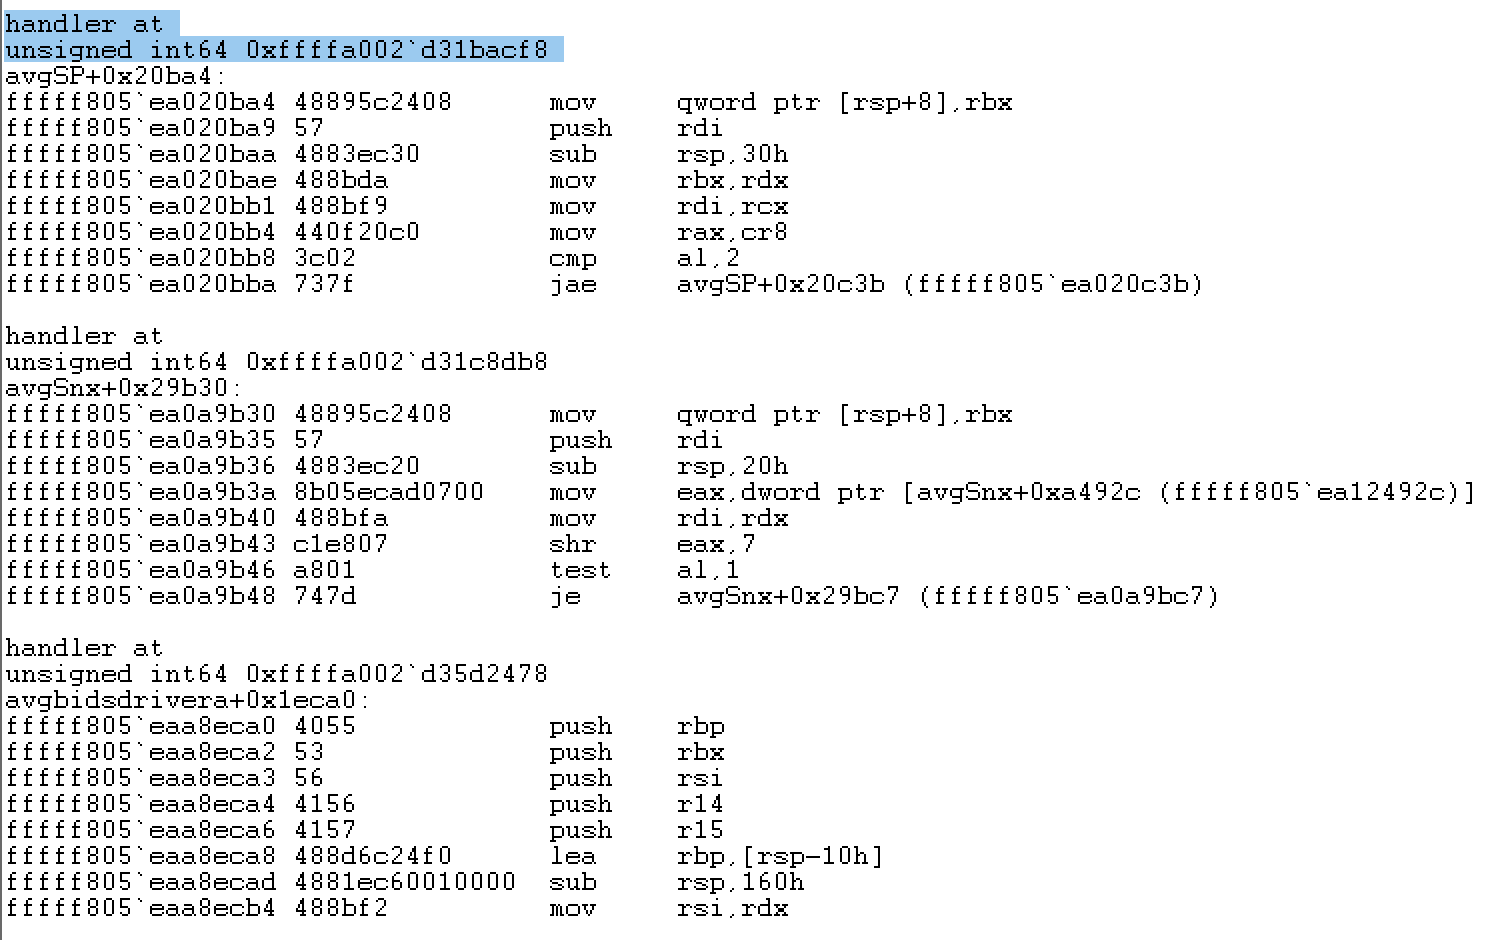
To unhook our OpenProcess filter, we first need to find the address of our PreOperation property corresponding to added filter function. This can be done with a bit of WinDBG command magic:
!list -x ".if (poi(@$extret+0x28) != 0) { .echo handler at; ?? @$extret+0x28; u poi(@$extret+0x28); }" (poi(nt!PsProcessType)+0xc8)
Once we have identified the correct address, we can NULL out the pointer to disable the handler using:
eq 0xffffa002`d31bacf8 0
At this point, if we attempt to re-attach our debugger, we get something that looks like this:

Awesome, so it looks like we have defeated the anti-debugger technique!
Well, almost… After a bit of interaction we start to notice quite a few errors being raised, and things don’t seem quite right. Even in the above screenshot we can see that register values are all 0, and access violations are shown… we must have missed something.
Don’t forget about threads
So we know that ObRegisterCallbacks allows us to hook on OpenProcess, but what else can it do? Well if we go back to the documentation, we also see that we can hook on OpenThread calls as well:

Luckily for us most of the hard work is already done, all we need to do is find the place where thread callbacks are stored, which just so happens to be in the aptly named nt!PsThreadType.
Let’s modify our earlier WinDBG command and see if the same driver has any hooks for OpenThread:
!list -x ".if (poi(@$extret+0x28) != 0) { .echo handler at; ?? @$extret+0x28; u poi(@$extret+0x28); }" (poi(nt!PsThreadType)+0xc8)

And there it is! Similar to our process hook, we will remove this with a similar eq command:
eq 0xffffc581`89df32e8 0
Attempt to reattach our debugger:

And there we have it, a fully working debugger session.
Hopefully this gives you a good introduction to this anti-debugging method used by quite a number of security products. If you found this interesting, there are plenty of Bug Bounties available, including a nice one for AVG on BugCrowd here, Cylance, Sophos… (although I wouldn’t try raising the above as a vulnerability, DKOM will likely be out of scope :).