Analysing RPC With Ghidra and Neo4j
Hunting for new lateral movement techniques or interesting ways to execute code can be a nice way to sink some free time. With Windows spawning numerous RPC services on boot, finding unusual execution techniques is sometimes as simple as scratching just below the surface. And often the payoff far outweighs the time to discovery, with SOC or EDR vendors focusing on the more common published techniques, identifying a new way to introduce code execution on a host can throw a spanner in the works of the investigating team.
In previous posts I’ve tried to look at different ways to mix up common attack signatures. Since working on posts exploring Mimikatz and lsass internals, I’ve had a few requests for information on how the demonstrated lsass DLL loading techniques were found, and how it may be possible to identify others. So in this post I wanted to present a workflow which I have found to be a useful when looking at Windows RPC method internals, and walk through some of the techniques I’ve used to minimise the grinding required to hunt for interesting vectors.
Before continuing, I should note that this post is aimed at those who are comfortable with low-level Windows functionality, and will not expose any 0dayzz or provide copy/paste lateral movement techniques. Instead the focus of this post is on providing ideas to hopefully help you to find some new and interesting techniques of your own.
So let’s start by considering what it is that we want to identify. Ideally this will be a service which can be interacted with either remotely via RPC in the case of lateral movement techniques, or locally exposed via LPC for introducing code into running processes.
Now when attempting to search for RPC services you will likely have come across RpcView, which is one of the few tools designed to expose RPC services with enough granularity as to even generate compilable IDL. While this tool is pretty amazing, I wanted to scratch that itch of understanding just how it goes about performing RPC enumeration. This also has the advantage of allowing me to craft something purpose built for my reversing toolkit. So in the first part of this post this is exactly what we will explore… just how this RPC enumeration is performed.
Once we have a way to extract RPC information from a process, we will need to understand if the exposed RPC methods lead to any kind of interesting API calls, for example CreateProcess or LoadLibrary. This is what we will concentrate on in the second part of the post.
Automating RPC enumeration
Starting with RPC enumeration, the way that I approached this was to take Rpcrt4.dll (which is the library provided by Windows to support the RPC runtime), as well as RpcView’s source, and use the two together to wrap my head around what is happening under the hood of Windows RPC.
Now before we get too ahead of ourselves we need to know just what an RPC server looks like. There is an excellent walkthrough provided by Microsoft on how to create this, so let’s take that as our base and throw together something which will expose a single method. I’ve added the project to Github here for reference.
If we refer to the [main](https://github.com/xpn/RpcExample/blob/master/RpcServerSample/RpcServerSample.cpp#L23) function of the example RPC project, you can see that there are a number of API’s used to spin up an RPC server:
RpcServerUseProtseqEp- Used to configure the endpoint to accept RPC connections.RpcServerRegisterIf- Used to register an RPC interface with the RPC runtime.RpcServerListen- Starts the RPC server listening.
Each of these API calls are exported from Rpcrt4.dll, so let’s throw that into Ghidra to see how these functions tick.
If we start with RpcServerUseProtseqEp, we find a check to identify if the RPC runtime has already been loaded within a process:

Here the global variable RpcHasBeenInitialized is validated, and if set to false, execution enters PerformRpcInitialization. Eventually this leads to a function of InitializeRpcServer which in turn initialises a global variable of GlobalRpcServer:

So what is GlobalRpcServer? Well referencing RpcView code, we find the answer within RpcInternals.h:
typedef struct _RPC_SERVER_T{
  MUTEX_T                        Mutex;
  ULONG                          __bIslistening;
  ULONG                          bIsListening;
  ULONG                          MinimumCallThreads;
  ULONG                          Wait;
  ULONG                          OutCalls;
  ULONG                          Unk1;
  ULONG                          InCalls;
  ULONG                          Unk2;
  SIMPLE_DICT_T                  AddressDict;
  ULONG                          lAvailableCalls;
  ULONG                          Unk3;
  SIMPLE_DICT_T                  _ProtSeqQueue;
  ULONG                          Unk4[8];
  ULONG                          OutPackets;
  ULONG                          Unk5;
  MUTEX_T                        Mutex2;
  ULONG                          MaxCalls;
  ULONG                          Unk6;
  VOID PTR_T                     hEvent;
  ULONG                          Unk7[4];
  SIMPLE_DICT_T                  InterfaceDict;
  ULONG                          _bIsListening;
  ULONG                          bIsMaxCalls1234;
  ULONG                          Unk8[6];
  ULONG                          InPackets;
  ULONG                          Unk9;
  RPC_FORWARD_FUNCTION PTR_T     pRpcForwardFunction;
  ULONG                          Unk10[6];
  SIMPLE_DICT_T                  AuthenInfoDict;
  LIST_ENTRY_T                   RpcIfGroupListEntry;
  ULONG    PTR_T                 __SRWLock;
  LIST_ENTRY_T                   field_1E0;
}RPC_SERVER_T, PTR_T PRPC_SERVER_T;
Here we see this object has a number of interesting fields useful for our RPC reversing effort. For now we pay particular attention to InterfaceDict, which is an instance of a SIMPLE_DICT_T. Again referring to RpcView’s code, we find the format of this struct as:
typedef struct _SIMPLE_DICT_T{
    VOID PTR_T PTR_T    pArray;
    UINT                ArraySizeInBytes;
    UINT                NumberOfEntries;
    VOID PTR_T          SmallArray[SIMPLE_DICT_SMALL_ARRAY];
}SIMPLE_DICT_T, PTR_T PSIMPLE_DICT_T;
Within this struct is the pArray field which is a pointer to RPC_INTERFACE_T with the following layout:
typedef struct _RPC_INTERFACE_T
{
  PRPC_SERVER_T              pRpcServer;
  ULONG                      Flags;
  ULONG                      Unk1;
  MUTEX_T                    Mutex;
  ULONG                      EpMapperFlags;
  ULONG                      Unk2;
  RPC_MGR_EPV PTR_T          pMgrEpv;
  RPC_IF_CALLBACK_FN PTR_T   IfCallbackFn;
  RPC_SERVER_INTERFACE_T     RpcServerInterface;
  PMIDL_SYNTAX_INFO          pSyntaxInfo;
  VOID PTR_T                 pTransfertSyntaxes;
  ULONG                      TransfertSyntaxesCount;
  ULONG                      __Field_C4;
  ULONG                      NbTypeManager;
  ULONG                      MaxRpcSize;
  UUID_VECTOR  PTR_T         pUuidVector;
  SIMPLE_DICT_T              RpcInterfaceManagerDict;
  UCHAR                      Annotation[MAX_RPC_INTERFACE_ANNOTATION];
  ULONG                      IsCallSizeLimitReached;
  ULONG                      currentNullManagerCalls;
  ULONG                      __Field_150;
  ULONG                      __Field_154;
  ULONG                      __Field_158;
  ULONG                      SecurityCallbackInProgress;
  ULONG                      SecurityCacheEntry;
  ULONG                      field_164;
  VOID PTR_T                 __SecurityCacheEntries[16];
  SIMPLE_DICT_T              FwEpDict;
  ULONG                      Unk3[6];
  struct RPCP_INTERFACE_GROUP PTR_T pRpcpInterfaceGroup;
}RPC_INTERFACE_T, PTR_T PRPC_INTERFACE_T;
Here we find a field of RpcServerInterface. This field is actually populated by the MIDL we created in our POC (found within [useless_s.c](https://github.com/xpn/RpcExample/blob/master/RpcServerSample/useless_s.c#L76)):
static const RPC_SERVER_INTERFACE useless___RpcServerInterface =
    {
    sizeof(RPC_SERVER_INTERFACE),
    {{0xaaf3c26e,0x2970,0x42db,{0x91,0x89,0xf2,0xbc,0x0e,0x07,0x3e,0x7c}},{1,0}},
    {{0x8A885D04,0x1CEB,0x11C9,{0x9F,0xE8,0x08,0x00,0x2B,0x10,0x48,0x60}},{2,0}},
    (RPC_DISPATCH_TABLE*)&useless_v1_0_DispatchTable,
    0,
    0,
    0,
    &useless_ServerInfo,
    0x04000000
};
Using RpcView’s definition of this struct, we find that the layout consists of:
typedef struct _RPC_SERVER_INTERFACE_T{
    UINT                     Length;
    RPC_IF_ID                InterfaceId;
    RPC_IF_ID                TransferSyntax;
    PRPC_DISPATCH_TABLE_T    DispatchTable;
    UINT                     RpcProtseqEndpointCount;
    PRPC_PROTSEQ_ENDPOINT_T  RpcProtseqEndpoint;
    RPC_MGR_EPV PTR_T        DefaultManagerEpv;
    void const PTR_T         InterpreterInfo;
    UINT                     Flags ;
} RPC_SERVER_INTERFACE_T, PTR_T PRPC_SERVER_INTERFACE_T;
Again there are a number of fields here which we know to be interesting from our MIDL generated code, such as the DispatchTable which is generated within our MIDL compilation as:
static const RPC_DISPATCH_TABLE useless_v1_0_DispatchTable =
    {
    2,
    (RPC_DISPATCH_FUNCTION*)useless_table
    };
Here the 2 value is actually the number of methods exposed, as we can see from the RPC_DISPATCH_TABLE struct’s definition:
typedef struct _RPC_DISPATCH_TABLE_T{
    UINT                            DispatchTableCount;
    RPC_DISPATCH_FUNCTION  PTR_T    DispatchTable;
    ULONG_PTR_T                     Reserved;
} RPC_DISPATCH_TABLE_T, PTR_T PRPC_DISPATCH_TABLE_T;
The other field we pay attention to from prior RpcServerInterface field is InterpreterInfo, which is populated with the following values in our example project:
static const MIDL_SERVER_INFO useless_ServerInfo =
    {
    &useless_StubDesc,
    useless_ServerRoutineTable,
    useless__MIDL_ProcFormatString.Format,
    useless_FormatStringOffsetTable,
    0,
    0,
    0,
    0};
The struct defining this layout is:
typedef struct  _MIDL_SERVER_INFO_T {
    PMIDL_STUB_DESC_T                pStubDesc;
    const VOID PTR_T PTR_T           DispatchTable;
    const unsigned char PTR_T        ProcString;
    const unsigned short PTR_T       FmtStringOffset;
    const VOID PTR_T PTR_T           ThunkTable;
    RPC_IF_ID PTR_T                  pTransferSyntax;
    ULONG_PTR_T                      nCount;
    VOID PTR_T                       pSyntaxInfo;
} MIDL_SERVER_INFO_T, PTR_T PMIDL_SERVER_INFO_T;
This structure holds an array of function pointers within its DispatchTable field which allows us to retrieve all methods exposed via the RPC interface, again defined within our example project as:
static const SERVER_ROUTINE useless_ServerRoutineTable[] =
    {
    (SERVER_ROUTINE)UselessProc,
    (SERVER_ROUTINE)Shutdown
    };
With an idea of the many memory structures we are going to have to traverse (and full credit to RpcView for identifying their layout and continually keeping them up to date), it’s pretty obvious that the first thing we need to find within memory is going to be GlobalRpcServer which is the root of all the subsequent structures we require.
Referring to Ghidra, we can see that this global variable resides within the .data section of memory:

To hunt for this pointer within memory, RpcView uses a technique of traversing each 8 bytes (in the case of x64 arch) of the .data section, and sanity checking potential fields within the structure as though this the correct pointer to a RPC_SERVER. If all the fields check out, RpcView knows it has a valid pointer to RPC_SERVER, and if not, it simply moves onto the next 8 bytes.
We will use this same strategy in our tooling to locate the same pointer, mainly:
- Locate the Rpcrt4.dll module in the target process memory.
- Hunt for the DLL
.datasection. - Reading each 8 bytes, dereferencing as a potential
RPC_SERVERpointer. - Validate fields such as
InterfaceDictto ensure that fields match expected values, such asNumberOfEntriesbeing a sensible value. - If the sanity check fails, move onto the next 8 bytes.
The code I finally settled on to implement these checks can be found here.
Hopefully if everything goes right we will have found our RPC_SERVER instance, meaning that all we need to do is traverse the required struct fields to identify each exposed method.
Now of course we could stop here, but it is sometimes useful to have the RPC method name for the potential method address. To expose the method name in the case of bundled Microsoft binaries, we can grab the PDB’s from Microsoft’s symbol server. To do this we utilise the Dbghelp libraries which allow us to programatically download each PDB and resolve each method name during runtime. This can be seen within the code here.
So what happens when we put all the pieces together? Well hopefully we get something that looks like this, reporting each exported RPC method from each process currently running:

Now while this gives us an indication that things are working, it is much more useful if we export identified RPC methods to a JSON file along with their identified address which can be ingested during further automation. This is simple enough using niohmann’s JSON C++ library.
The full project source for this RpcEnum can be found here. Presently this works for Windows 10 1903 on x64 binaries and hopefully gives you an idea of how to craft something similar.
Preparing Ghidra with Headless analysis
With the ability to enumerate and extract RPC method names and addresses from a process, we next require a way to analyse each method to help identify subsequent calls made. Now doing this manually would take quite a bit of time, but thankfully Ghidra exposes a headless analyser which allows extension scripts to be executed against a project without having to open or interact with the UI.
Now we know up front which DLL’s and EXE’s we are going to work with, so we need to analyse each and add them to a project in Ghidra for later scripting. I chose to do this using the following command, passing each module as an argument:
.\support\analyzeHeadless.bat C:\Ghidra Windows.gpr -import C:\windows\system32\target.dll
Once completed (and you may want to take a break while this runs as it will certainly take a while), we will have a single Ghidra project containing analysed EXE’s and DLL’s consisting of RPC methods:

With a project created containing the modules we are interested in, we next need to find an efficient way to explore all of this data. One way that I found particularly useful is to create call graphs for each exposed RPC method, to help understand external Win32 API calls made. To generate this I used a simple Python script which would parse our previously generated JSON files, and invoke headless Ghidra instances with a custom Jython post-script for each module. A very simple python script to do this can be found here.
Our Ghidra Jython post-script will leverage Ghidra’s exposed API to analyse RPC methods recursively, helping to map a a call graph for each. A simple example of how to do this can be found here. Once executed, we can then create a CSV file consisting of internal and Win32 functions which are invoked by each exposed RPC method:

With a CSV file containing all the information we need to hunt for potentially useful code-paths, let’s take it one step further by attempting to create a call graph which to be explored interactively.
Neo4j, not just for Bloodhound
Many of you will have come across Neo4j due to Bloodhound, which has done a lot to expose the Infosec community to the usefulness of graph theory, however this technology has use way beyond hunting for DA on a AD network.
Before we start to explore the power of Neo4j, we first need to know how we can convert our data into the required graph view. Neo4j actually allows you to import data directly from a CSV file. To do this, we first create our nodes with something like:
USING PERIODIC COMMIT
LOAD CSV WITH HEADERS FROM "file:/log-int.csv" AS csv
FIELDTERMINATOR ' '
MERGE (f:IntFunction {name:csv.name, module:csv.module });

USING PERIODIC COMMIT
LOAD CSV WITH HEADERS FROM "file:/log-ext.csv" AS csv
FIELDTERMINATOR ' '
MERGE (f:ExtFunction {name:csv.name, module:csv.module });

USING PERIODIC COMMIT
LOAD CSV WITH HEADERS FROM "file:/log-rpc.csv" AS csv
FIELDTERMINATOR ' '
MERGE (f:RPCFunction {name:csv.name, module:csv.module });
Next we need to create relationships (or edges) between each node. The obvious relationship would be “calls”, where we would mark how each function is invoked by a subsequent function. To do this, we can use a call such as:
USING PERIODIC COMMIT
LOAD CSV WITH HEADERS FROM "file:/log-int.csv" AS csv
FIELDTERMINATOR ' '
MATCH (f {name:csv.calledby, module:csv.calledbymodule })
MATCH (f2 {name:csv.name, module:csv.module})
MERGE (f)-[:Calls]->(f2)

USING PERIODIC COMMIT 500
LOAD CSV WITH HEADERS FROM "file:/log-ext.csv" AS csv
FIELDTERMINATOR ' '
MATCH (f {name:csv.calledby, module:csv.calledbymodule })
MATCH (f2 {name:csv.name, module:csv.module})
MERGE (f)-[:Calls]->(f2)

USING PERIODIC COMMIT 500
LOAD CSV WITH HEADERS FROM "file:/log-rpc.csv" AS csv
FIELDTERMINATOR ' '
MATCH (f {name:csv.calledby, module:csv.calledbymodule })
MATCH (f2 {name:csv.name, module:csv.module})
MERGE (f)-[:Calls]->(f2)
When loaded, we should find ourselves with call graphs now available and searchable within a database, as shown by the NetrJobEnum RPC method below:

With a database full of relationships which we can interactively explore, it’s becomes much easier to identify potentially interesting code paths. For example, if we want to identify each RPC method which will eventually make a Win32 API call such as LoadLibraryExW less than 3 hops away, we can do so with a Cypher query of:
MATCH p=(:RPCFunction)-[:Calls*3]->(:ExtFunction {name: "LoadLibraryExW"}) RETURN p

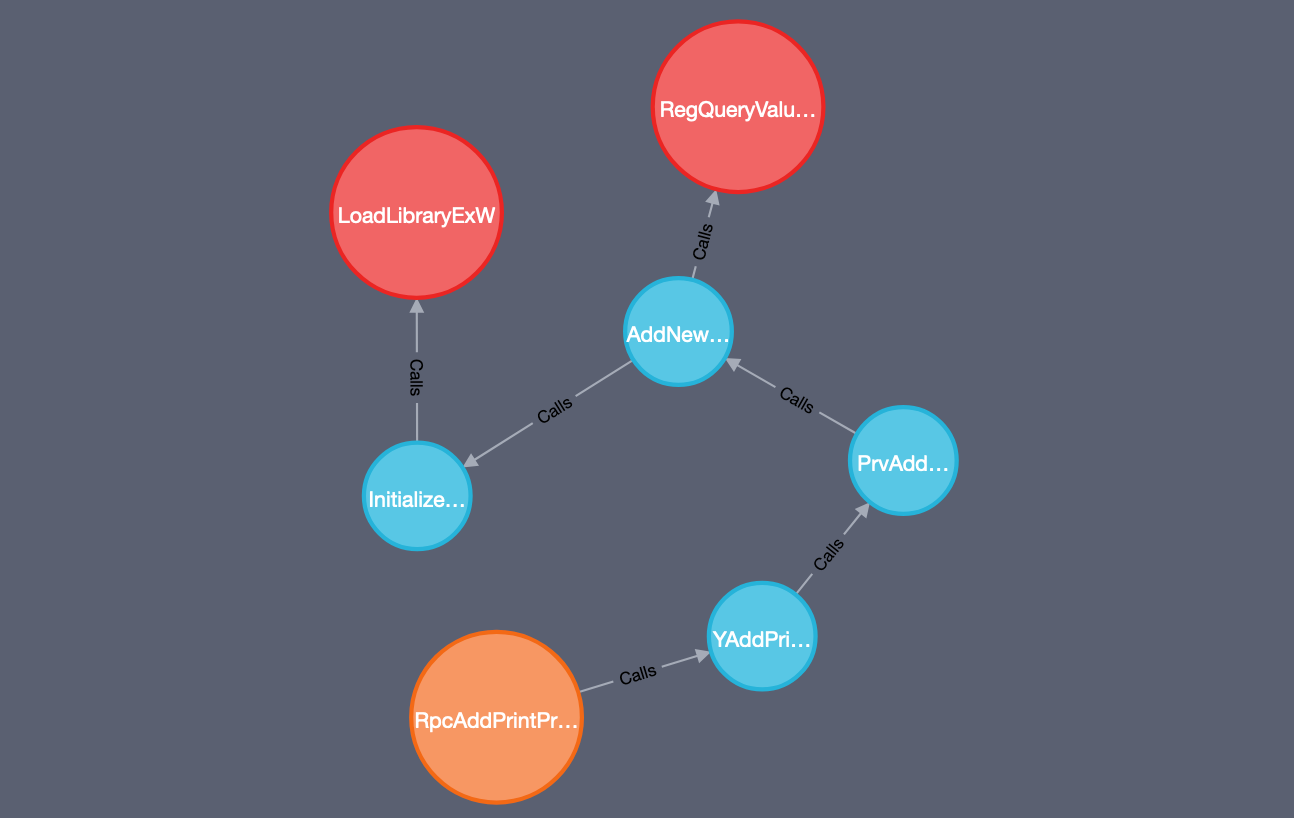
How about we change that to identify code paths which not only invoke LoadLibraryExW, but also invoke a registry API such as RegQueryValueExW:

So hopefully this provides an idea of just how powerful Neo4j can be when combined with the right dataset, and has shown just how simple it can be to cobble together a toolchain with the purpose of hunting through services for interesting code paths.
Still a work in progress
For those of you following along, you have likely seen a number of areas which could be improved when exploring nodes in Neo4j.
The first area is Control Flow Guard which, while handled well in 9.0.4 of Ghidra, still shows up as a node within our call graph and breaks code paths when attempting to recursively identify invoked functions. At the moment this appears to be due to virtual methods invoked from a vtable which are presently are not analysed very well by Ghidra and will result in the familiar __guard_dispatch_icall function surfacing.
The second area is initial loading speed. While exploring calls using Neo4j speeds up the analysis phase (for me at least), there is a tradeoff currently in the amount of time it takes to load our data into the database. My knowledge of Neo4j isn’t great, so there will likely be ways to improve the performance of loading data into the database and discovering relationships.
These are the areas which I’m looking to work on as I continue to explore the potential attack surface of RPC and LPC, but if you have any suggestions of ways to improve this, feel free to give me a shout in the usual places.